What is the MEXC Market Movers Board?
1. What is the Market Movers Board?
Status Type | Time-Frame | Condition | |
New High | Today High | 24 hours | The highest price in the past 1 minute equals today's / this week's / this month's highest price.
Update Frequency: Every 1 minute |
Weekly High | 24×7 hours | ||
Monthly High | 24×30 hours | ||
Price Up | 5m Tick | Within 5 minutes | Token price increase 3% ≤ rise < 7%.
Update Frequency: Every 1 minute |
2H Tick | Within 2 hours | ||
5m Rise | Within 5 minutes | Token price increase 7% ≤ rise < 11%.
Update Frequency: Every 1 minute | |
2H Rise | Within 2 hours | ||
5m Surge | Within 5 minutes | Token price increase ≥ 11%.
Update Frequency: Every 1 minute | |
2H Surge | Within 2 hours | ||
New Low | Today Low | 24 hours | The lowest price in the past 1 minute equals today's / this week's / this month's lowest price.
Update Frequency: Every 1 minute |
Weekly Low | 24×7 hours | ||
Monthly Low | 24×30 hours | ||
Price Down | 5m Dip | Within 5 minutes | Token price decrease 3% ≤ drop < 7%.
Update Frequency: Every 1 minute |
2H Dip | Within 2 hours | ||
5m Drop | Within 5 minutes | Token price decrease 7% ≤ drop < 11%.
Update Frequency: Every 1 minute | |
2H Drop | Within 2 hours | ||
5m Plunge | Within 5 minutes | Token price decrease ≥ 11%.
Update Frequency: Every 1 minute | |
2H Plunge | Within 2 hours | ||
Pullback | Pullback | —— | (Daily High − Daily Open) / Daily Open ≥ 8% and (1-minute candlestick close − Daily High) / Daily High ≤ −5%.
Update Frequency: Every 1 minute |
Rally | Rally | —— | (Daily Low − Daily Open) / Daily Open ≤ −8% and (1-minute candlestick close − Daily Low) / Daily Low ≥ 5%.
Update Frequency: Every 1 minute |
Price Up & High Vol. | Tick, High Vol. | —— | 7% ≤ 15-minute price increase < 11% and 15-minute trading volume ≥ 50× the average of the past 24 fifteen-minute periods.
Update Frequency: Every 10 seconds |
Rise, High Vol. | —— | 11% ≤ 15-minute price increase < 15% and 15-minute trading volume ≥ 50× the average of the past 24 fifteen-minute periods.
Update Frequency: Every 10 seconds | |
Surge, High Vol. | —— | 15-minute price increase ≥ 15% and 15-minute trading volume ≥ 50× the average of the past 24 fifteen-minute periods.
Update Frequency: Every 10 seconds | |
Price Down & High Vol. | Dip, High Vol. | —— | 7% ≤ 15-minute price decrease < 11% and 15-minute trading volume ≥ 50× the average of the past 24 fifteen-minute periods.
Update Frequency: Every 10 seconds |
Drop, High Vol. | —— | 11% ≤ 15-minute price decrease < 15% and 15-minute trading volume ≥ 50× the average of the past 24 fifteen-minute periods.
Update Frequency: Every 10 seconds | |
Plunge, High Vol. | —— | 15-minute price decrease ≥ 15% and 15-minute trading volume ≥ 50× the average of the past 24 fifteen-minute periods.
Update Frequency: Every 10 seconds |
2. How to Access the Market Movers Board
2.1 Web
2.2 App
Popular Articles
View More
What Is MarsCoin (MARSCOIN)? Inside the BNB Chain Token Pairing Meme Culture With SPCXB Rewards
Overview MarsCoin (MARSCOIN) is a BNB Chain token built around a Mars-themed community narrative and an unusual trading structure. Rather than being designed only as a conventional meme token paired

Binance Fees Explained: What a $1,000 Trade Really Costs on Spot, Futures and Withdrawal
Binance charges regular users 0.10% maker and 0.10% taker on spot, 0.02% maker and 0.05% taker on USDT-margined futures, and a flat withdrawal fee that depends on the network. Paying fees in BNB cuts

What Is HAJIMI? Meaning, Contract Address, and How to Buy
哈基米 (HAJIMI) is a meme coin on BNB Chain built around one of the most widely shared cat memes in Chinese internet culture. The token has no whitepaper, no named founding team, and no technical

Hot Crypto Updates
View More
What Is a Meme Stock? The Full Picture Behind the Tokenized Stock Narrative Exploding on Robinhood Chain and BSC Chain
Recently, the Robinhood Chain ecosystem has exploded, with memecoins posting strong growth. What makes this trend particularly interesting is that these memecoins are paired directly with specific

1inch Launches Aqua: Shared Liquidity Across 13 Blockchains Opens a New Chapter for DeFi
1inch has officially launched Aqua, a new liquidity protocol deployed across 13 blockchains, including Ethereum, Arbitrum, Base, and BNB Chain. Unlike traditional liquidity models that require users

Why Is KAZAR Price Surging Today? 3 Catalysts to Watch
Overview KAZAR is gaining attention today as traders react to rising short-term volatility, renewed interest in Web3 gaming narratives, and early-stage price discovery around a relatively new and

Trending News
View More
Printr Shutdown: Why the Airdrop Was Canceled
Printr has announced that it will discontinue operations on August 31, 2026, and cancel its anticipated airdrop. The decision closes a short but eventful period for a project that attempted to build a
BNC Stock Surges as Its BNB Treasury Returns to Focus
BNC stock jumped 50% as tokenized-stock speculation returned. See how its 515,544 BNB treasury and governance risks shape the trade.


Related Articles
View More
The Complete Guide to Coin-M Perpetual Futures on MEXC
In cryptocurrency derivatives, Futures trading enables investors to apply leverage to increase potential returns and to take positions in both rising and falling markets. MEXC offers two primary types
What Is the Long/Short Ratio? How to View Long/Short Ratio Data in Futures Trading?
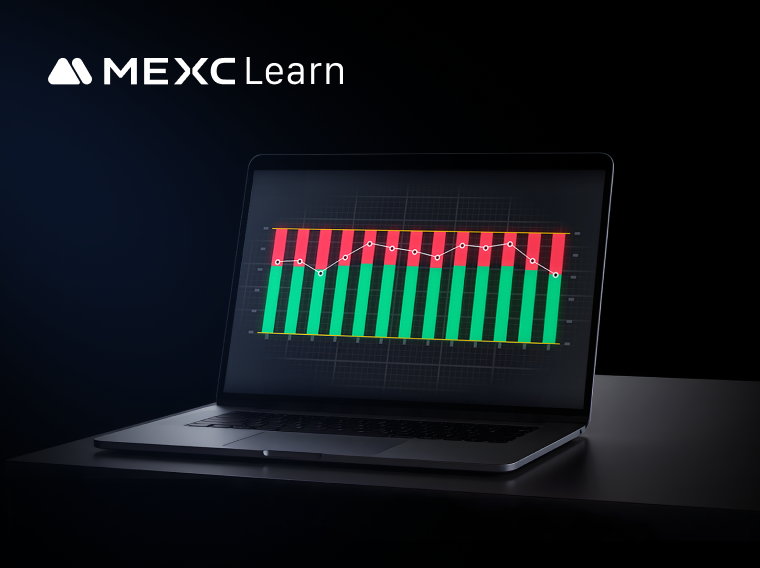
BSL refers to long/short closing data. Currently, on the MEXC platform, both candlestick charts and line charts in Futures trading support the display of historical order data for long/short ratios. I
Why Choose MEXC Futures?
Cryptocurrency futures trading has attracted countless investors with its promise of high leverage and high returns. Choosing the right exchange is the first step on the journey to successful futures