

Arbitrum (ARB) Price Has One Barrier Left Before a Potential 2x Explosion
Arbitrum price has been stuck in a steady downtrend for months, and the latest chart setup is starting to draw attention for a different reason. Price action on the ARB chart now shows a clear descending channel that has been in place since August 2025, and recent movement near the lower boundary is starting to change the tone.
That reaction reveals something important. A pattern that held price down for months may now be setting up the next major move.
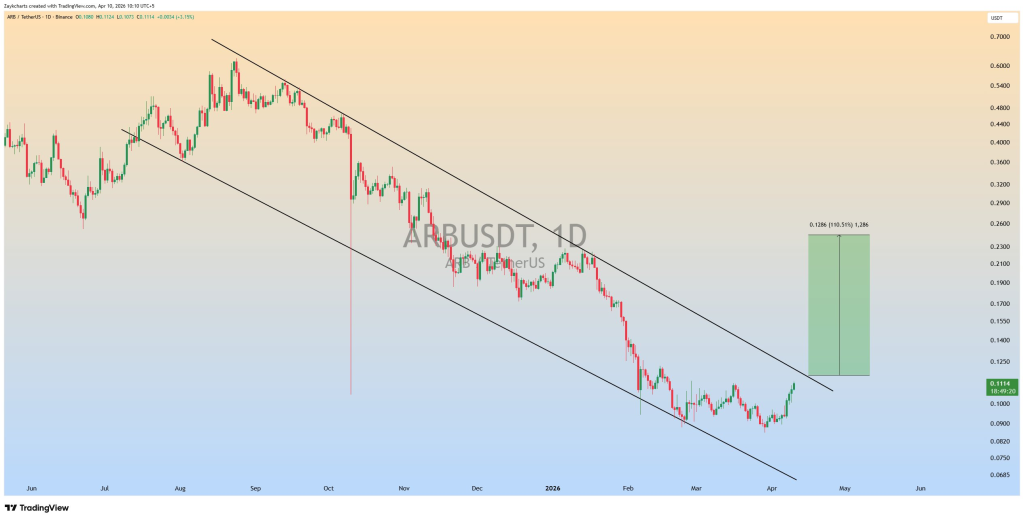
A closer look at the ARB chart shows a well-defined descending channel that has guided price action since August 2025. Lower highs and lower lows formed consistently within two parallel trendlines, which confirms a controlled bearish structure rather than random volatility.
Price recently touched the lower boundary of this channel near $0.08 before bouncing toward the mid-range. The current price sits close to $0.11, and that recovery is starting to test the upper resistance trendline again.
 @ZAYKCharts / X
ZAYK Charts pointed out this exact structure and noted that a breakout from this descending channel could open the door for a strong upside move. The projection on the chart suggests a potential move toward the $0.23 to $0.25 region, which would represent more than 100% upside from current levels.
Another factor deserves attention. Descending channels often act as continuation patterns during downtrends, yet they can also turn into reversal setups once price breaks above resistance with strength.
Daily Indicators Show Bullish Signals Building Under The Surface
The technical indicators on the daily timeframe are already leaning toward buyers. Data from Investing.com shows a strong cluster of bullish signals across multiple indicators:
| Name | Value | Action |
|---|---|---|
| RSI (14) | 66.525 | Buy |
| STOCH (9,6) | 59.348 | Buy |
| MACD (12,26) | 0.002 | Buy |
| Williams %R | -8.046 | Overbought |
| Highs/Lows (14) | 0.0119 | Buy |
| Ultimate Oscillator | 64.453 | Buy |
| ROC | 22.444 | Buy |
These readings paint a clear picture. Momentum indicators such as RSI and MACD show growing strength, which means buyers are gradually taking control. The Rate of Change also confirms that price acceleration is moving upward.
Williams %R shows an overbought reading, which may slow down short-term upside. That does not cancel the broader setup. Overbought conditions during early trend reversals often appear before strong breakouts.
ZAYK Charts highlighted that this combination of structure and indicators creates a high probability zone for a breakout attempt. The key detail here is that indicators are turning bullish before price has actually broken resistance.
Read Also: Why Buying 550 Internet Computer (ICP) Tokens Today Could Be Like Buying 21 BTC in 2014
Resistance From The Descending Channel Remains The Key Barrier
The descending channel still acts as the main obstacle for ARB price. The upper trendline has rejected multiple rally attempts since late 2025, which makes it a strong resistance level that cannot be ignored.
Price is now approaching that same resistance again. A clean break above it would change the structure from bearish to neutral or even bullish. That shift could trigger fresh buying interest as the market reacts to a change in trend.
Historical patterns also offer clues. Similar channel breakouts in other altcoins often lead to fast moves because sellers lose control at the same time buyers step in.
ZAYK Charts continues to monitor this level closely, noting that confirmation will depend on a decisive move above resistance rather than a temporary spike.
Read Also: HBAR Price Catalyst? Meet Hedera’s Full Enterprise Suite
A confirmed breakout from the descending channel would likely send ARB toward the next resistance zone around $0.20 to $0.25. That move aligns with the measured projection shown on the chart.
Failure to break out could keep ARB trading within the channel for a longer period. Price may revisit lower support levels if resistance holds again.
The next few weeks may decide the direction. Indicators already support the bullish case, yet structure still requires confirmation.
Subscribe to our YouTube channel for daily crypto updates, market insights, and expert analysis.
The post Arbitrum (ARB) Price Has One Barrier Left Before a Potential 2x Explosion appeared first on CaptainAltcoin.


You May Also Like

Is Adam Back Satoshi Nakamoto? CEO Responds to New York Times Investigation
Ranking Republican admits to White House reporter he regrets Trump vote: 'Make it stop!'


