Ethereum Price Reclaims Weekly Moving Average as $2,400 Resistance Holds
TLDR
- Ethereum closed the week near $2,327, above a key weekly moving average.
- ETH reclaimed the weekly moving average for the first time since October 2025.
- Ethereum has traded between $2,250 and $2,450 for nearly a month.
- Binance ETH reserves rose to 3.62 million ETH in May, CryptoQuant data shows.
- Traders are watching $2,280-$2,300 support and $2,400 resistance.
Ethereum price has moved back above a key weekly moving average for the first time since October 2025, putting its recovery structure back in focus as traders monitor whether ETH can hold the $2,300 area and attempt another move toward $2,400.
ETH closed the week near $2,327, slightly above the blue moving average line on the weekly Coinbase chart shared by analyst Sky. The move marked Ethereum’s first weekly close above the 20-period moving average since October 2025.
Source: Cryptoquant
The recovery follows a rebound from February and March lows near the $1,750 to $1,950 area. Since then, Ethereum has gradually returned to the $2,300 zone, where traders are watching for confirmation that the recent move can continue.
Moving averages are often used by traders as trend filters. A weekly close above a key average can suggest improving momentum, although Ethereum still remains below a higher red moving average near $3,154. That level remains a longer-range resistance area for ETH.
Ethereum Price Recovery Faces $2,400 Test
The $2,300 to $2,350 area is now a key short-term zone for Ethereum. Holding above this region could keep the recovery structure intact and allow traders to focus on the next upside levels near $2,550 and $2,850.
A failed hold above the moving average could weaken the setup and return attention to support around $2,150. That area may become important if ETH loses momentum near current levels.
Analyst Sky compared the latest move with Ethereum’s October 2025 breakout, when ETH later climbed from around $2,400 to $5,000. The comparison has drawn attention from traders, but the current market still needs stronger follow-through before a similar recovery can be confirmed.

Ethereum has repeatedly struggled near the $2,400 level. Analyst Ted said ETH failed to reclaim that area again and identified $2,280 to $2,300 as the next support range to watch for a possible rebound.
That range aligns with the broader view that Ethereum remains in a consolidation phase rather than a clear breakout. A daily and weekly move above $2,400 would likely be watched as a stronger signal that buyers are gaining control.
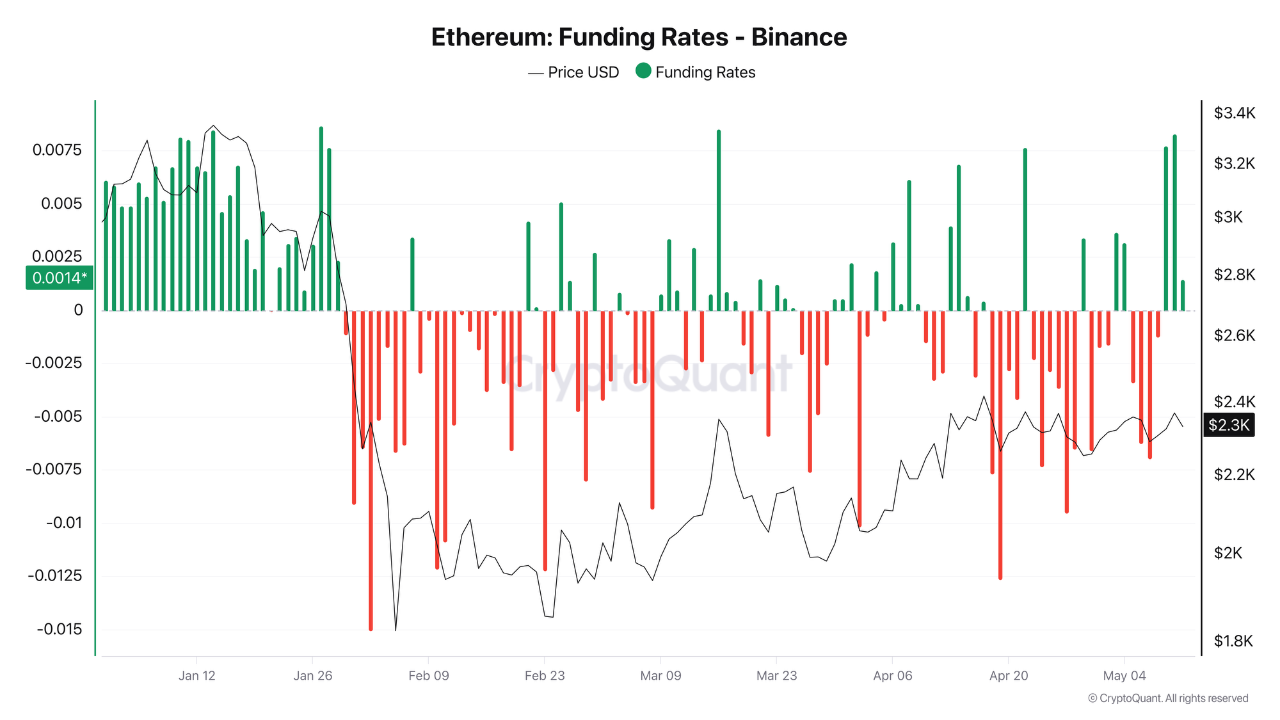
Derivatives Activity Cools During Consolidation
Ethereum has traded between roughly $2,250 and $2,450 for nearly a month. The range formed after a rally of about 33% from the February low, giving the market time to reset after a sharp recovery.
During the rebound, Ethereum open interest increased by about $4.5 billion, showing renewed activity in derivatives markets. Binance’s estimated leverage ratio for ETH rose to 0.76 on March 16, pointing to a rapid rise in leveraged positions.
Source: Cryptoquant
Funding rates were mostly negative during that period, suggesting that many traders were still positioned bearishly even as ETH recovered. More recently, funding rates turned positive as long positions became more common.
At the same time, Binance’s ETH estimated leverage ratio fell sharply to 0.57 while ETH tested resistance near $2,450. The decline suggests that some leveraged positions were closed, either by traders taking profits or by liquidations during the rally.
Lower leverage can reduce the risk of abrupt forced selling or buying. For Ethereum to break out of its current range, spot demand may need to replace leverage-driven activity.
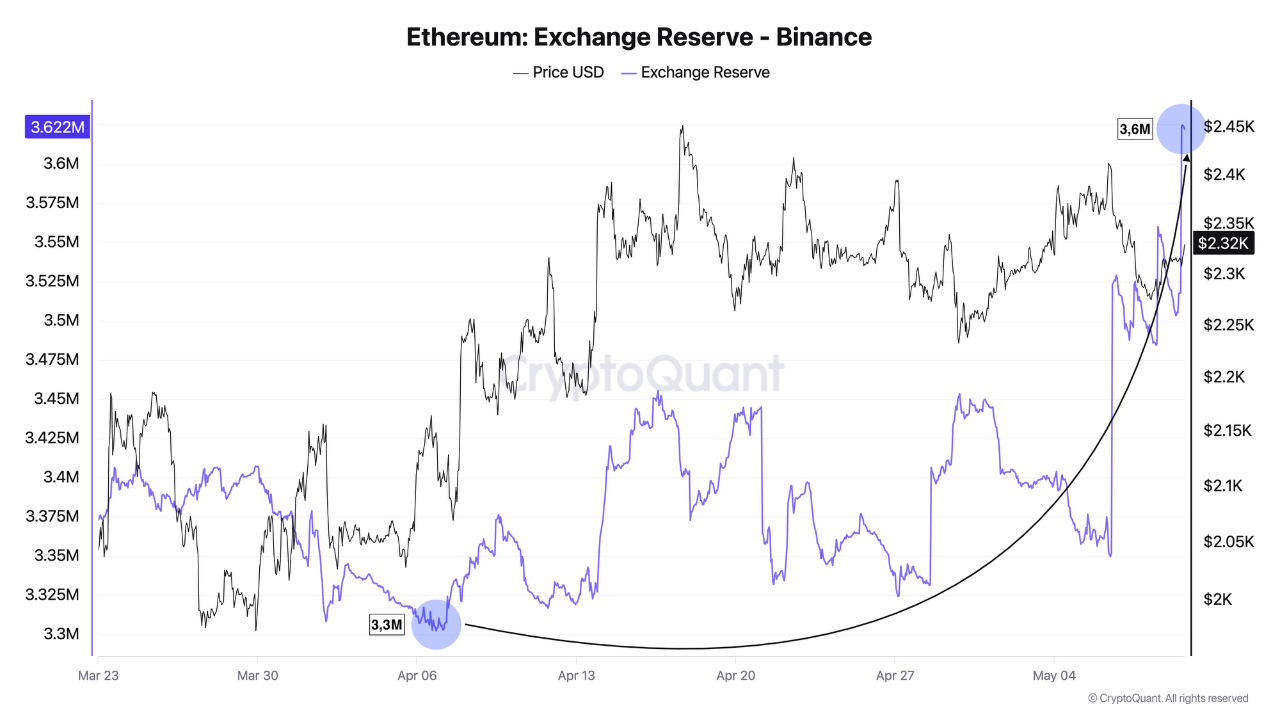
Exchange Reserves Show ETH-BTC Difference
Exchange reserve data shows a difference between Ethereum and Bitcoin market conditions. Ethereum reserves on Binance rose to 3.62 million ETH in May, representing about 24.6% of all Ether held across exchanges, according to CryptoQuant data.
Rising exchange balances can mean more tokens are available for sale. If demand is not strong enough to absorb that supply, price gains can face pressure.
Bitcoin reserves on Binance have moved in the opposite direction, falling during the same period. Lower Bitcoin exchange reserves are often viewed as a sign that more coins are moving into longer-term storage, reducing available supply on trading platforms.
Source: Cryptoquant
This difference places Ethereum under more immediate sell-side pressure than Bitcoin. It also reflects a wider market pattern in which Bitcoin has shown tighter exchange liquidity while ETH continues to face a larger available supply.
Ethereum’s long-term chart still shows price trading inside a rising channel on the monthly timeframe. That structure keeps the broader upside setup active, but ETH needs to clear near-term resistance before traders can confirm stronger momentum.
The post Ethereum Price Reclaims Weekly Moving Average as $2,400 Resistance Holds appeared first on CoinCentral.


You May Also Like

GOP in disarray as Senate seat pick-up slips away: 'It's a mess'

Is Pepecoin (PEPE) Era Ending? 19K Investors Watch This New Cheap Altcoin