

Bitcoin price falls under $77K as ETFs record $1B outflows
U.S. spot Bitcoin ETFs recorded more than $1 billion in cumulative net outflows over the past week as institutional investors reduced exposure to the asset.
- U.S. spot Bitcoin ETFs recorded over $1 billion in cumulative net outflows last week as institutional demand for crypto exposure weakened sharply.
- Bitcoin fell below the $77,000 support level after over $661 million in crypto liquidations wiped out heavily leveraged bullish positions.
- Rising inflation concerns and WTI crude prices above $107 added pressure on risk assets as traders reduced expectations for Fed rate cuts.
According to data from SoSoValue, the latest withdrawals mark a sharp reversal after several weeks of strong inflows that had previously helped support Bitcoin’s recovery above the $80,000 region earlier this month.
Spot Ethereum ETFs also remained under pressure, extending their recent streak of daily net outflows with $255 million exiting the funds last week as institutional appetite across the broader crypto market weakened further.
The latest outflows coincided with a broader market decline that pushed Bitcoin (BTC) below the key $77,000 psychological support level on Monday. BTC fell more than 4% over the past 24 hours, dropping from recent highs near $82,000 to an intraday low around $76,500 before stabilizing slightly near $77,000 at press time.
According to CoinGlass data, more than $661 million worth of crypto positions were liquidated over the past 24 hours, with bullish long positions accounting for nearly 95% of the wipeout.
Bitcoin’s decline also came as rising inflation concerns and elevated oil prices weakened appetite for speculative assets.
Recent Producer Price Index data surged 6% year-over-year following a stronger-than-expected Consumer Price Index reading of 3.8%, reinforcing fears that the Federal Reserve may keep interest rates elevated for longer than previously expected.
Meanwhile, WTI crude futures climbed above $107 per barrel after stalled U.S.-Iran negotiations and continued Strait of Hormuz disruptions fueled broader inflation concerns across global markets.
Higher interest rates typically reduce market liquidity and increase the attractiveness of safer fixed-income investments relative to volatile assets such as cryptocurrencies.
Despite the recent selloff, Bitcoin’s broader medium-term structure remains relatively constructive on the daily chart.
Bitcoin price has now fallen back below the key $80,000 psychological support region after facing rejection near the $82,000–$84,000 resistance zone earlier this month.
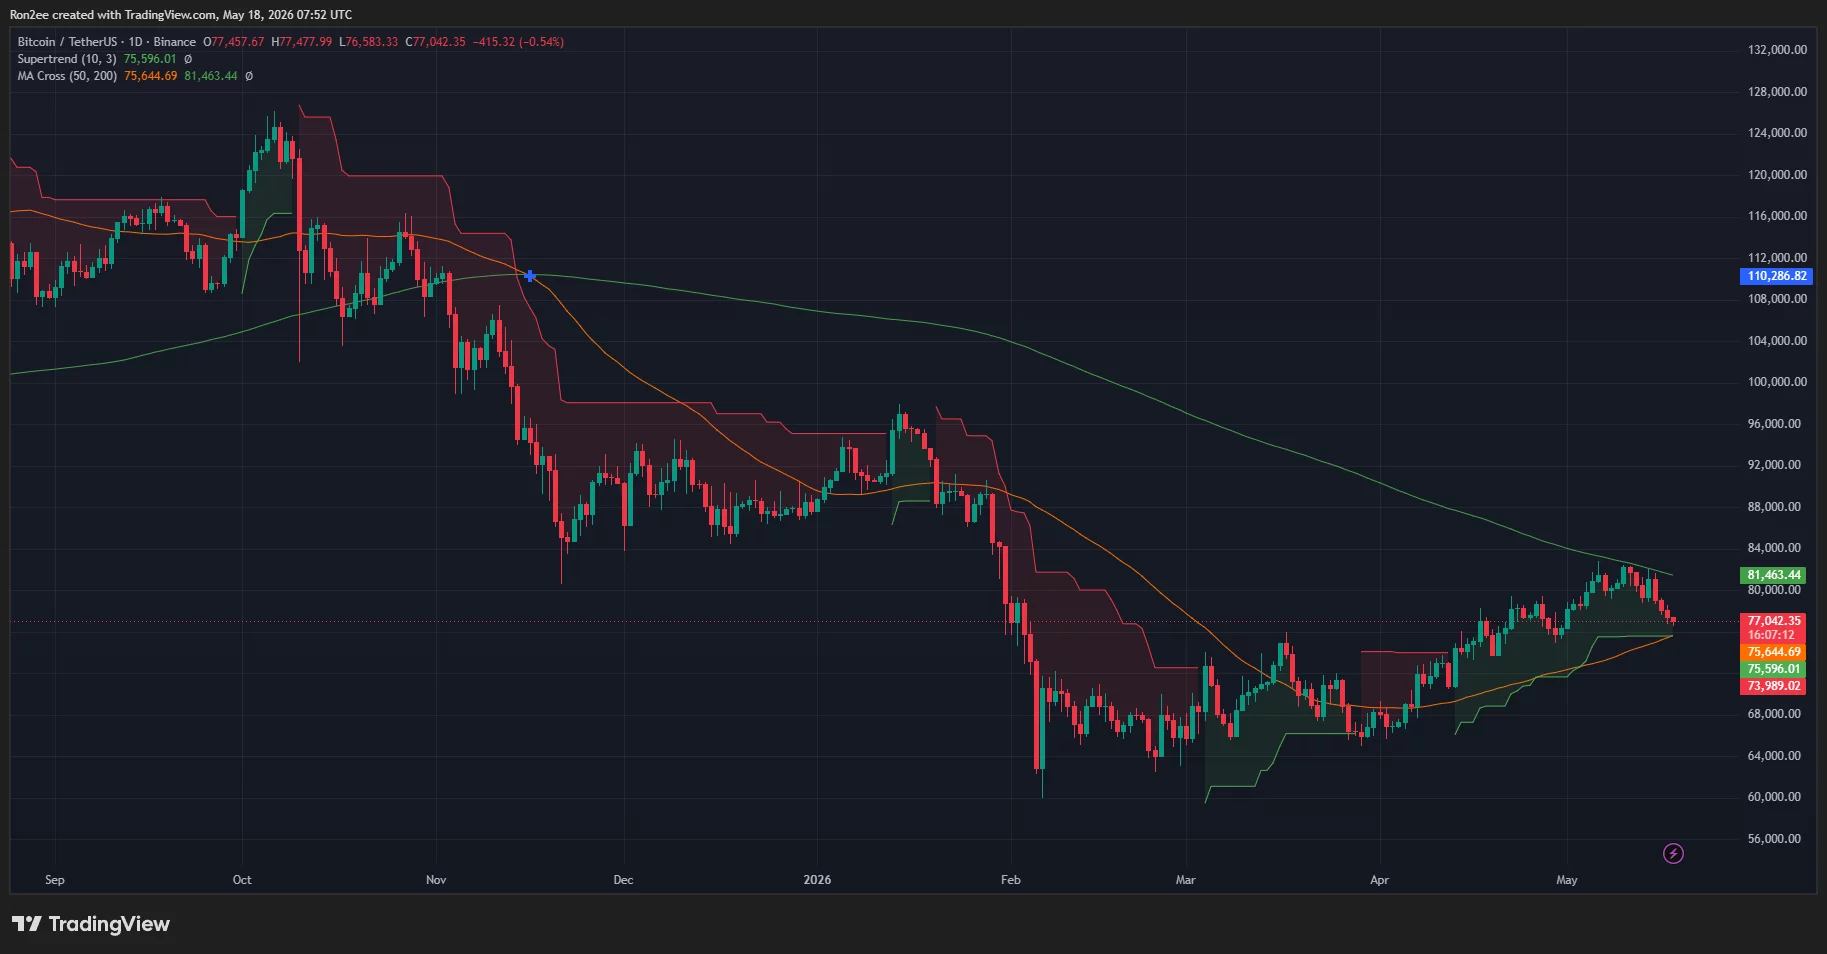
Despite the latest pullback, BTC continues holding above its 50-day simple moving average near $75,500, while the Supertrend indicator also remains bullish around the same region, suggesting that the broader medium-term uptrend structure remains intact for now.
Meanwhile, the 50-day SMA continues approaching a potential bullish crossover above the 200-day SMA near $81,400, forming what traders commonly refer to as a golden cross.
However, short-term momentum has weakened following the latest selloff, with Bitcoin now struggling to reclaim the $80,000 level.
If bulls manage to push BTC back above $80,000, the token could soon attempt another move toward the broader resistance cluster between $81,400 and $84,000.
On the downside, failure to hold above the current support structure could expose Bitcoin to a deeper correction toward the $75,500–$73,900 region, where both the 50-day SMA and Supertrend support currently converge.
Disclosure: This article does not represent investment advice. The content and materials featured on this page are for educational purposes only.


You May Also Like

Grok AI Predicts Binance Coin Price if the SEC Approves a Spot BNB ETF in 2026

Why Businesses Need Professional Machine Design and Development Services


