

XRP Price Weakens Again, Key Demand Area Tested After Steady Downmove
XRP price started a fresh decline below $2.150. The price is now attempting to recover and faces resistance near the $2.15 pivot level.
- XRP price started a fresh decline below the $2.10 zone.
- The price is now trading below $2.150 and the 100-hourly Simple Moving Average.
- There is a bearish trend line forming with resistance at $2.150 on the hourly chart of the XRP/USD pair (data source from Kraken).
- The pair could continue to move down if it settles below $2.020.
XRP Price Faces Resistance
XRP price attempted a recovery wave above $2.20 but failed to continue higher, like Bitcoin and Ethereum. The price started a fresh decline below $2.150 and $2.120.
There was a move below the $2.050 support level. A low was formed at $2.025, and the price is now attempting a recovery wave. There was a move toward the 23.6% Fib retracement level of the downward move from the $2.525 swing high to the $2.025 low.
The price is now trading below $2.150 and the 100-hourly Simple Moving Average. If there is a fresh upward move, the price might face resistance near the $2.140 level. There is also a bearish trend line forming with resistance at $2.150 on the hourly chart of the XRP/USD pair.
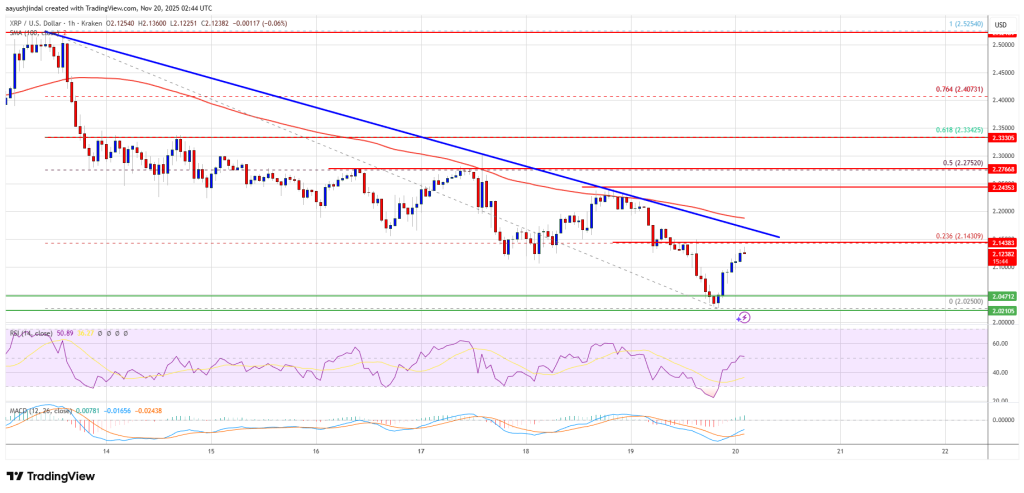
The first major resistance is near the $2.20 level. A close above $2.20 could send the price to $2.250. The next hurdle sits at $2.2750 or the 50% Fib retracement level of the downward move from the $2.525 swing high to the $2.025 low. A clear move above the $2.2750 resistance might send the price toward the $2.320 resistance. Any more gains might send the price toward the $2.350 resistance. The next major hurdle for the bulls might be near $2.420.
Another Drop?
If XRP fails to clear the $2.150 resistance zone, it could start a fresh decline. Initial support on the downside is near the $2.050 level. The next major support is near the $2.020 level.
If there is a downside break and a close below the $2.020 level, the price might continue to decline toward $1.9650. The next major support sits near the $1.920 zone, below which the price could continue lower toward $1.880.
Technical Indicators
Hourly MACD – The MACD for XRP/USD is now losing pace in the bearish zone.
Hourly RSI (Relative Strength Index) – The RSI for XRP/USD is now above the 50 level.
Major Support Levels – $2.050 and $2.020.
Major Resistance Levels – $2.150 and $2.250.


You May Also Like

Ink Token Listing Date Near as Mining End Announced by cPen Network
CRCL Selloff Explained: Russell Growth Removal and Open USD Pressure Reprice Circle’s Stablecoin Story


