

Ethereum Price Declines Again, Consolidates Below $3K After Latest Breakdown
Ethereum price failed to stay above $3,000 and tested $2,770. ETH is now attempting to recover but faces resistance near $2,880.
- Ethereum started a fresh decline after it failed to stay above $3,000.
- The price is trading below $3,000 and the 100-hourly Simple Moving Average.
- There is a key bearish trend line forming with resistance at $3,050 on the hourly chart of ETH/USD (data feed via Kraken).
- The pair could continue to move down if it settles below the $2,800 zone.
Ethereum Price Dips Further
Ethereum price failed to continue higher above $3,050 and started a fresh decline, like Bitcoin. ETH price dipped below $3,000 and entered a bearish zone.
The decline gathered pace below $2,880 and the price dipped below $2,800. A low was formed at $2,770 and the price is now consolidating losses below the 23.6% Fib retracement level of the recent decline from the $3,058 swing high to the $2,770 low.
Ethereum price is now trading below $3,000 and the 100-hourly Simple Moving Average. If there is another recovery wave, the price could face resistance near the $2,920 level and the 50% Fib retracement level of the recent decline from the $3,058 swing high to the $2,770 low.
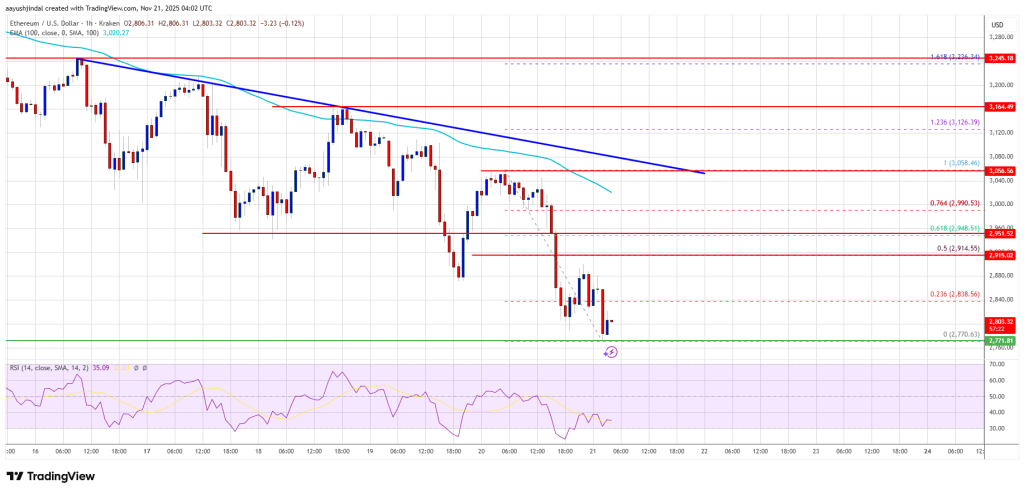
The next key resistance is near the $2,950 level. The first major resistance is near the $3,050 level. There is also a key bearish trend line forming with resistance at $3,050 on the hourly chart of ETH/USD. A clear move above the $3,050 resistance might send the price toward the $3,120 resistance. An upside break above the $3,120 region might call for more gains in the coming days. In the stated case, Ether could rise toward the $3,220 resistance zone or even $3,250 in the near term.
Another Drop In ETH?
If Ethereum fails to clear the $2,920 resistance, it could start a fresh decline. Initial support on the downside is near the $2,770 level. The first major support sits near the $2,740 zone.
A clear move below the $2,740 support might push the price toward the $2,680 support. Any more losses might send the price toward the $2,620 region in the near term. The next key support sits at $2,550 and $2,500.
Technical Indicators
Hourly MACD – The MACD for ETH/USD is gaining momentum in the bearish zone.
Hourly RSI – The RSI for ETH/USD is now below the 50 zone.
Major Support Level – $2,770
Major Resistance Level – $3,050


You May Also Like

The changing face of elder care in Malaysia — Sayed Mohammad Reza Yamani Sayed Umar

Not a loophole: Singapore AI export controls let China tap US AI legally

Bitcoin, Gold, and U.S. Stocks Dive as Trump Pledges to Hit Iran ‘Extremely Hard’


