

Pi Network Price Prediction 2026–2032: Can Pi Reclaim Its All-Time High soon?
Key Takeaways:
- Pi price faces volatility below the $0.17 level.
- Our Pi network price prediction anticipates the Pi price to reach a maximum level of $0.5695 by 2026.
- In 2032, the Pi price prediction expects Pi to reach a maximum level of $1.71.
Pi Network is a social crypto and developer ecosystem focused on mass accessibility and real-world use, founded by Stanford PhDs Dr. Nicolas Kokkalis and Dr. Chengdiao Fan. As 2026 unfolds, Pi continues to operate as a live Layer-1 blockchain with open transfers, exchange liquidity, and a growing app ecosystem. After reaching an all-time high of $2.98 on Feb. 26, 2025, Pi has extended its decline, recording a new all-time low of $0.1312 Feb 11, 2026, as weak demand kept price action pressured.
Despite the volatility, the ecosystem has continued to evolve. Pi Network has expanded KYC and Mainnet migration access by unblocking millions of previously restricted Pioneers and preparing to open KYC submissions for more than 700,000 additional users, while continuing batch processing focused on security and compliance.
On the infrastructure side, Pi is also rolling out a series of Mainnet protocol upgrades following the successful Protocol v19.6 migration, with v19.9 set as the final step before the broader v20 release and has warned node operators to complete required upgrades by the latest deadline (Step 2) to avoid losing connection to the network.
In this Pi Network price prediction, we discuss these developments, major technical levels, and the model of an exponential supply of Pi in decline to determine whether 2026–2032 favors a sustained recovery or further downside.
Overview
| Cryptocurrency | Pi Network |
| Ticker Symbol | Pi |
| Price | $0.1691 |
| Price Change 24h | -1% |
| Market Cap | $1.59B |
| Circulating Supply | 9.41B PI |
| Trading Volume 24h | $14.58M |
| All-Time High | $2.98, Feb 26, 2025 |
| All-Time Low | Feb 11, 2026 $0.1312 |
Pi Network Price Prediction: Technical Analysis
| Metric | Value |
| Current Price | $0.1691 |
| Price Prediction | $ 0.1271(-24.89%) |
| Fear & Greed Index | 14 (Extreme Fear) |
| Sentiment | Bearish |
| Volatility | 8.82% (High) |
| Green Days | 13/30 (43%) |
| 50-Day SMA | $ 0.1743 |
| 200-Day SMA | $ 0.2722 |
| 14-Day RSI | 53.07 (Neutral) |
Pi Price Analysis
TL;DR Breakdown:
- Pi price analysis reveals that PI is forming a stabilization near $0.167 following a slight recovery, with price still capped below the $0.17 handle.
- The current immediate Pi resistance is at $0.1695.
- Pi support is forming near $0.1655.
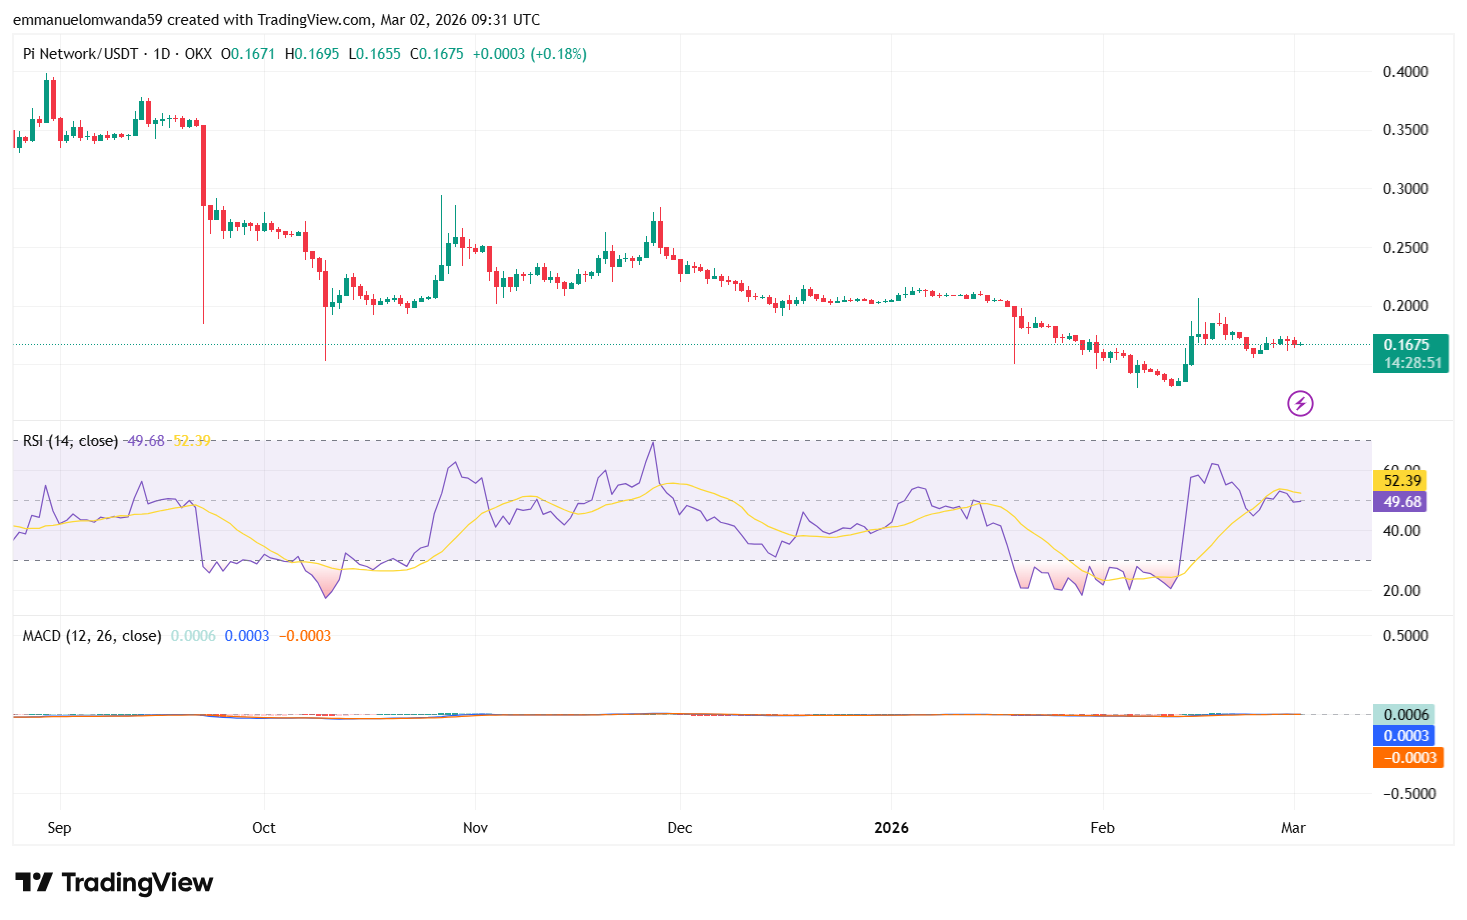
As of March 2, 2026, Pi is trading at $0.1675, up by 0.18% on the day. PI opened at $0.1671, hit a high of $0.1695, dropped to a low of $0.1655, and closed at $0.1675, suggesting tight-range consolidation following the selloff in the previous week. PI’s market cap is about $1.58B, while 24h volume is $11.59M, down 25.91%, meaning fewer traders are active today and the market is waiting for a stronger move.
Pi price analysis 1-day chart: Pi struggles below $0.17 as momentum stalls
On the daily time frame, Pi is facing resistance pressure just below the $0.17 psychological level. After attempting to push higher, the price failed to sustain momentum above $0.1695, triggering mild profit-taking and keeping PI capped within a narrow range between $0.1655 and $0.1695.
 PI/USDT Chart: TradingView
RSI (14) is at 49.68 (RSI MA: 52.39), indicating neutral momentum. Buyers are trying to recover control, but PI still hasn’t pushed decisively above the midline.
MACD shows the MACD line at 0.0006, signal line at 0.0003, and histogram at -0.0003, which points to weak momentum the market is trying to turn up, but the move is not strong yet.
Immediate support stands at $0.1655, while resistance remains at $0.1695. A break below $0.1655 would put pressure back on the recent base, while a clean push above $0.1695 would improve the odds of a test of the $0.17 psychological level next.
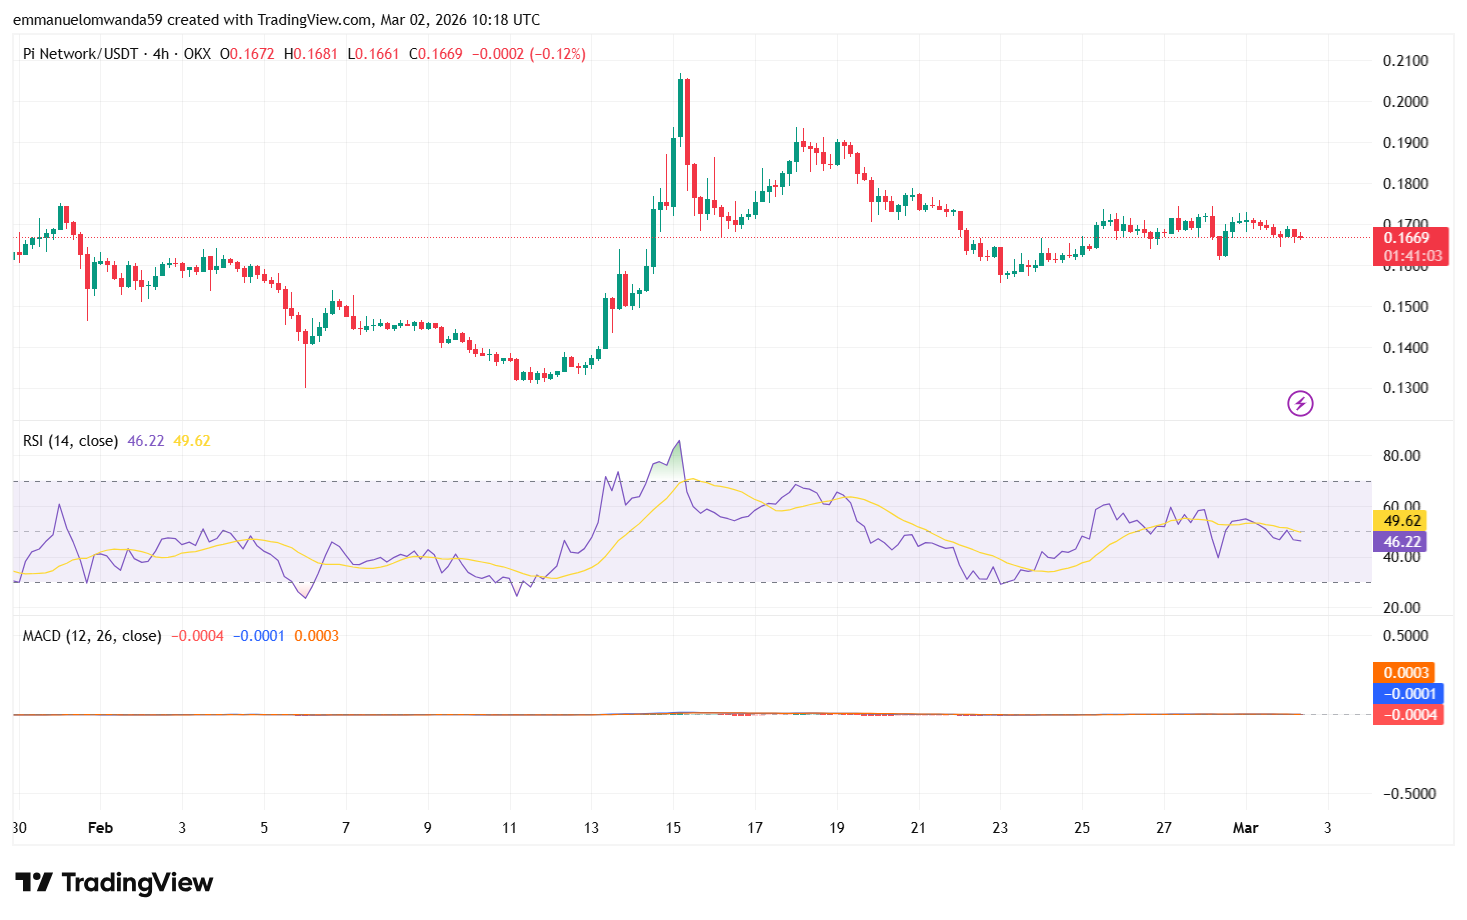
Pi/USD 4-Hour Price Analysis
On the 4-hour timeframe, Pi is experiencing mild weakness since the price is struggling to sustain itself above the $0.167 level. Pi has opened at $0.1672, reached a high of $0.1681, dropped to a low of $0.1661, and is currently trading at $0.1669. The narrow range portrays a short-term consolidation and not aggressive selling.
 PI/USDT Chart: TradingView
The RSI (14) stands at 46.22, with its moving average at 49.62, indicating that momentum is bearish but still close to neutral territory. This suggests that buyers are not fully in control, yet sellers also lack strong dominance.
The MACD (12, 26) shows the MACD line at -0.0004, the signal line at -0.0001, and the histogram at 0.0003, signaling weak momentum with no strong direction. The flattening structure suggests that the market is waiting for a breakout move.
Immediate support in the 4hour chart is forming near $0.1661, while short-term resistance stands at $0.1681. A break below support could push Pi toward the $0.165 zone, while reclaiming $0.1681 may open the door for a retest of the $0.17 psychological level.
Pi Network Price Prediction: Levels and Action
Daily Simple Moving Average (SMA)
| Period | Value | Action |
| SMA 3 | $0.1849 | SELL |
| SMA 5 | $0.1774 | SELL |
| SMA 10 | $0.1708 | SELL |
| SMA 21 | $0.1655 | BUY |
| SMA 50 | $0.1743 | SELL |
| SMA 100 | $0.2157 | SELL |
| SMA 200 | $0.2722 | SELL |
Daily Exponential Moving Average (EMA)
| Period | Value | Action |
| EMA 3 | $ 0.1683 | BUY |
| EMA 5 | $ 0.1737 | SELL |
| EMA 10 | $ 0.1843 | SELL |
| EMA 21 | $ 0.1947 | SELL |
| EMA 50 | $ 0.2086 | SELL |
| EMA 100 | $ 0.2389 | SELL |
| EMA 200 | $ 0.3270 | SELL |
What to expect from the Pi price analysis next?
Pi is likely to continue consolidating between $0.166 and $0.169 in the short term as momentum remains weak and indecisive. A breakout above $0.17 could trigger a stronger recovery move, while a drop below $0.166 may reopen downside pressure toward lower support zones.
Why is PI’s price up today?
Pi’s price is up today mainly because short-term buyers stepped in near the $0.165 support level, triggering a mild rebound toward the $0.17 zone. The broader crypto market is relatively stable, and with lighter trading volume, even modest buying pressure is enough to push the price slightly higher.
Is Pi a Good Investment?
Pi is a high-risk, speculative investment that could offer upside if its ecosystem grows and adoption increases. However, its price remains volatile and dependent on overall market conditions, so investors should be prepared for uncertainty.
Will Pi Price Reach $5?
At the current pace of development and given its total PI supply circulating supply of over 8 billion PI, Pi Network’s value is unlikely to reach $5 in the near term. Multiple technical quantitative indicators and fundamental factors, such as delayed mainnet launch and maximum supply constraints, suggest that Pi’s price may fluctuate within lower ranges before any major uptrend. A $5 target would require sustained adoption, significant on-chain activity, and strong market demand that is not yet present.
Will Pi Reach $10?
Reaching $10 would represent a massive increase in Pi’s market cap, something that is not expected soon under current crypto market conditions. Analysts suggest that even optimistic forecasts place this milestone more than a decade away, if at all. Investors should treat such projections as speculative investment advice and conduct their own research before making investment decisions, as Pi remains a high-risk asset with uncertain long-term value.
Recent Pi News/Opinions
Pi Network marked its first Open Network anniversary, reporting 17.7 million KYC-verified users, over 300 ecosystem apps (triple from 2025), and 148,000+ sellers in local commerce. The founders emphasized a utility-first token model designed for user acquisition.
Pi Price Prediction March 2026
In March 2026, Pi’s price may attempt to maintain an average of $0.2053 and could rise to $0.2456 if bullish momentum strengthens and selling pressure eases. However, if the market rejects the upside move, Pi could slide lower and consolidate around a new minimum near $0.165.
| Pi Price Prediction | Potential Low | Potential Average | Potential High |
| Pi Price Prediction March 2026 | $0.165 | $0.2053 | $0.2456 |
Pi Price Prediction 2026
The price of 1 Pi is expected to reach a minimum level of $0.4418 in 2026. The PI price can reach a maximum level of $0.5695 with the average price of $0.514 throughout 2026..
| Pi Price Prediction | Potential Low ($) | Potential Average ($) | Potential High ($) |
| Pi Price Prediction 2026 | $0.4418 | $0.514 | $0.5695 |
Pi Price Predictions 2027-2032
| Year | Minimum Price ($) | Average Price ($) | Maximum Price ($) |
| 2027 | $0.1987 | $0.2273 | $0.256 |
| 2028 | $0.4657 | $0.5274 | $0.5891 |
| 2029 | $0.6120 | $0.6900 | $0.7680 |
| 2030 | $0.7477 | $0.8216 | $0.8950 |
| 2031 | $0.9825 | $1.07 | $1.16 |
| 2032 | $1.34 | $1.52 | $1.71 |
Pi Price Prediction 2027
Pi price is forecast to reach a lowest possible level of $0.1987 in 2027. As per our findings, the PI price could reach a maximum possible level of $0.256 with the average forecast price of $0.2273.
Pi Price Prediction 2028
In 2028 the price of Pi is predicted to reach at a minimum level of $0.4657. The PI price can reach a maximum level of $0.5891 with the average trading price of $0.5274.
Pi Price Prediction 2029
In 2029, Pi’s price is projected to reach a minimum of $0.6120. The PI price could rise to a maximum of $0.7680, with an average trading price of $0.6900 throughout the year..
Pi Price Prediction 2030
In 2030, Pi is forecast to trade at a minimum level of $0.7477. The PI price could reach a maximum of $0.8950, with an average forecast price of $0.8216.
Pi Price Prediction 2031
In 2031, Pi’s price is expected to hold a minimum value of $0.9825. The PI price could climb to a maximum of $1.16, with an average trading value of $1.07.
Pi Price Prediction 2032
In 2032, Pi is expected to reach a minimum price of $1.34. The PI price could rise to a maximum of $1.71, with an average value of $1.52.
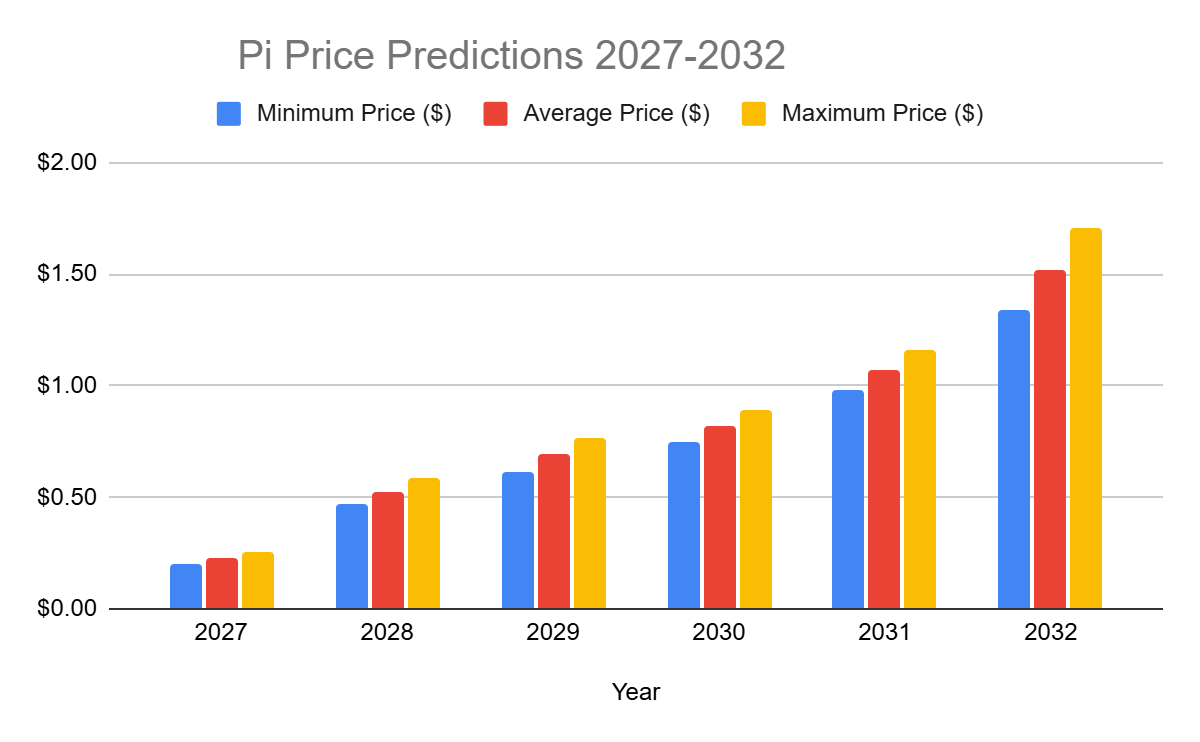 Pi Price Prediction 2027-2032
Pi Network Price Prediction: Analysts’ Pi Price Forecast
| Firm Name | 2026 | 2027 |
| Coincodex | $0.4616 | $ 0.4080 |
| DigitalCoinPrice | $ 0.2310 | $ 0.2420 |
Cryptopolitan’s Pi Price Prediction
At Cryptopolitan, we remain constructively bullish on Pi’s long-term outlook, despite weak short-term momentum. Investors are keenly watching the Pi Network market to discern potential movements in its future price trends and analyse shifts in Pi Network’s price, seeking independent professional consultation for informed decisions.
In 2026, the price of 1 Pi is expected to reach a minimum level of $0.4418 in 2026. The PI price can reach a maximum level of $0.5695 with the average price of $0.514 throughout 2026.
Pi Historic Price Sentiment
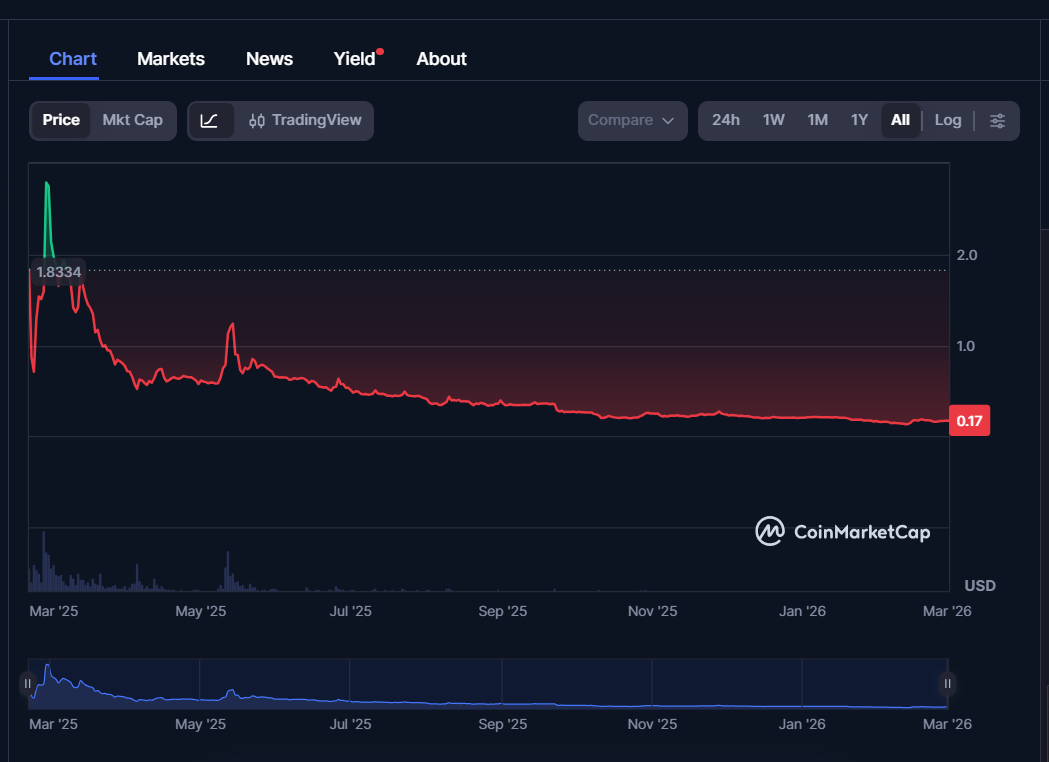 PI Price History: Coinmarketcap
- Pi Network launched in 2019 with a mobile mining model. During these years, it operated in a closed network with no official market price, as tokens couldn’t be traded externally.
- In 2023, the token was still largely unlisted on major exchanges. Price remained speculative, often appearing in unofficial markets with wide variances.
- By early 2024, the first signs of market traction were still limited. Prices ranged between $0.60 and $1.00 over-the-counter or in the sandbox.
- In February 2025, official market traction began. Pi hit its all-time high (ATH) of $2.98 on February 26 after initial listings or increased public speculation.
- In March 2025, the price dropped significantly when Pi Network had an unstable phase after the expiration of its final KYC verification deadline. Traded between $1.85 and $0.90, gradually declining through the month.
- In April 2025, Pi Network hit its all-time low (ATL) of $0.4012 on April 5. Prices ranged between $0.40 and $0.65, showing weak recovery momentum.
- In May 2025, the Pi Network surged toward $1.67 but failed to maintain its buying demand. This resulted in a significant downward pressure toward $0.75 by the end of the month.
- In June, Pi showed a sideways-to-bullish movement, with the potential to break above $0.66 and target $0.72.
- At the start of July 2025, Pi Network faced high volatility as massive token unlocks triggered strong selling pressure, keeping prices around the $0.458–$0.50 range.
- On July 19, 2025, PIUSDT declined slightly to $0.4412, reflecting short-term bearish pressure.
- On July 26, 2025, PIUSDT continued to hover under pressure around $0.4409, staying within a tight trading range as momentum remained subdued.
- for August 2, 2025. Pi traded at $0.3496, still under pressure and at its all-time low.
- On August 6, 2025, Pi Network traded at around $0.3410, showing moderate consolidation with weak momentum and limited price movement.
- On August 9th, Pi/USDT went up from its early August low of $0.3766 and traded around $0.4103.
- August 17th, 2025, the Pi Network (PI) traded at $0.387, showing slight movement between support at $0.383 and resistance at $0.390.
- On August 21, Pi Network (PI) traded near $0.366, showing a modest 1.39% gain as buyers attempted a short-term recovery.
- On September 2, 2025, Pi network traded around $0.34, just above its past month’s August all-time low of $0.3304.
- On September 22, 2025, Pi crashed to a new all-time low (ATL) of $0.2234, marking a –92% drop from its February ATH and reflecting heavy sell-side pressure from token unlocks and weak demand.
- Pi rebounded slightly, to trade between $0.25 and $0.28 through late September, though resistance at $0.30 continued to hold firmly.
- At the start of October 2025, Pi trades at $0.2718, but is still struggling under bearish sentiment as buyers attempt to defend support above $0.26 while momentum indicators suggest only a weak recovery.
- On October 11, 2025, Pi Network hit a new all-time low of $0.1585, reflecting the peak of a prolonged market crash and severe selling pressure.
- On October 15, 2025, Pi Network (PI) stabilized slightly, trading around $0.1884, as short-term buyers stepped in following the sharp October 11 crash.
- On October 28, 2025, PI attempted a short rebound toward $0.238, but failed to hold gains, slipping back below the 20-day moving average.
- As of the start of November 2025, Pi Network traded at approximately $0.247, still below key resistance at $0.26, as traders remain cautious ahead of the upcoming 120 million token unlock expected in November.
- As of November 15, Pi network traded at $0.223. This rise for 1 day was driven by technical breakout signals, whale accumulation, and ongoing ecosystem updates.
- As of November 30, 2025, Pi Network traded around $0.243, consolidating above the $0.24 support zone while still below the $0.26 resistance heading into month-end.
- As of December 1, 2025, Pi Network had dropped to about $0.226, as sellers reacted to December’s 190M PI token unlock overhang and a broader risk-off mood in the crypto market.
- As of December 16, 2025, Pi Network traded around $0.196, having broken below the psychological $0.20 support as ongoing token unlocks, legal uncertainty, and sustained bearish technical momentum kept strong downside pressure on the price.
- As of late December 2025, Pi Network traded in the low-$0.20 range around $0.205, moving sideways as selling pressure eased, but trading volume stayed light, and buyers remained cautious after the mid-month dip below $0.20.
- At the start of 2026, Pi continued to hover near the $0.20–$0.21 zone, showing early stabilization above the key $0.20 level, with the market still weighing ongoing supply unlocks against slower demand growth.
- On January 15, 2026, Pi traded around $0.205 and closed near $0.2046 after slipping from the $0.21 area, showing a controlled pullback with buyers still defending the low-$0.20 zone.
- By the end of January 2026, Pi Network was holding in the mid-$0.16 range, with rebounds capped below $0.18 as bearish momentum and oversold conditions kept price action fragile.
- As of February 11, 2026, Pi Network hit a new all-time low (ATL) of $0.1312.
- By the end of February 2026, Pi Network was trading in the $0.16 and $0.17 range, attempting to stabilize after rebounding from its February 11 all-time low of $0.1312.


You May Also Like

EUR/GBP Upside Risks Surge: UK Political Turmoil Threatens Sterling – ING

Stablecoin Firm KAST Hires Former SEC Advisor Stephanie Allen to Drive Americas Expansion
