

BNB price clings to lower band near $830 amid bearish pressure
BNB price hovered near $830 as increased trading activity and falling open interest showed traders cutting risk during the recent pullback.
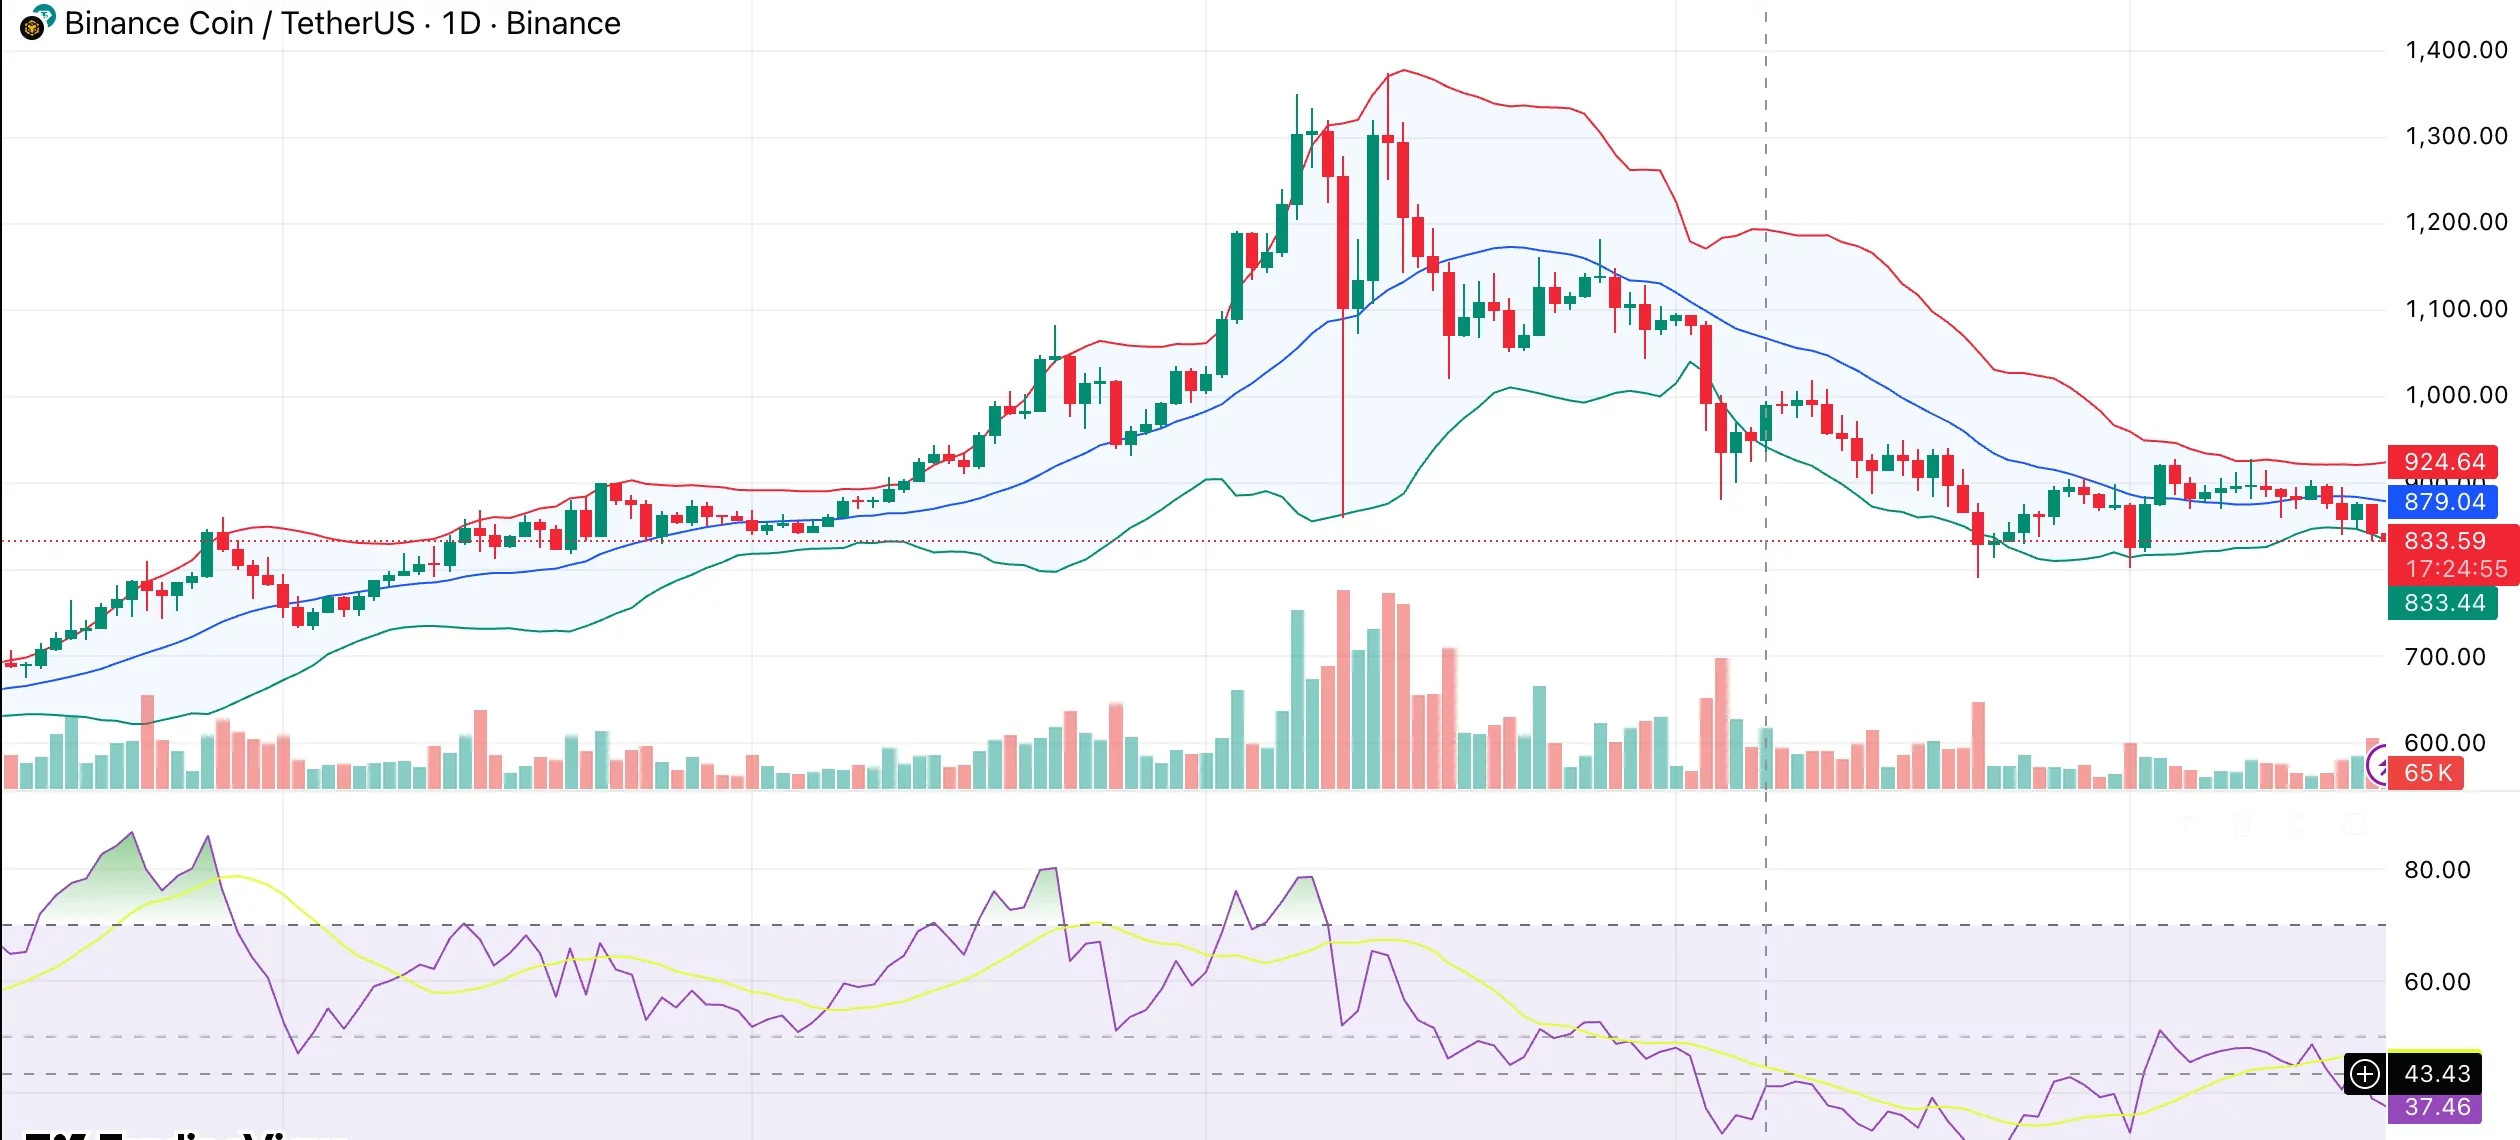
- BNB trades near lower Bollinger Band after a sharp drop from recent highs.
- Volume rose while open interest fell, pointing to position unwinding.
- Charts still favor sellers unless price reclaims key resistance levels.
BNB changed hands at $832 at press time, falling roughly 4% over the past 24 hours as the recent pullback extended. Price has moved between $830 and $899 over the last seven days and is now down 4.3% on the week. Losses are deeper on a longer time frame, with BNB down 8.4% over the past 30 days and still 39% below its October peak of $1,369.
Trading activity picked up during the decline. BNB (BNB) recorded $2.51 billion in volume over the last 24 hours, up 33.6% from the previous day. This jump in volume points to active repositioning rather than quiet consolidation as the price moved lower.
Derivatives data adds context to the move. According to CoinGlass data, derivatives volume surged 48% to $2.03 billion, while open interest fell 1.72% to $1.33 billion. This mix suggests traders are closing positions into volatility, with leveraged exposure being reduced.
Fundamentals stay firm despite price weakness
The pullback comes even as BNB’s longer-term fundamentals continue to improve. Abu Dhabi Global Market recently granted Binance full regulatory approval, making it the first cryptocurrency exchange to receive exchange, clearing, and brokerage licenses under the framework. Binance’s reputation among institutions and regulators is enhanced by the approval.
BNB Chain is also seeing increased adoption in real-world applications. BlackRock’s tokenized treasury fund is now supported by the network, which enhances institutional credibility and generates real on-chain demand.
In addition, BNB’s auto-burn mechanism has been reducing the supply in circulation, strengthening its long-term value proposition.
There are also signs of steadier leadership, with Changpeng Zhao becoming more publicly engaged again after closing out legal proceedings. Attention is now turning back to stronger positioning in the U.S. market.
BNB price technical analysis
BNB trades close to the lower Bollinger Band near $830. Price behavior here reflects steady downside pressure rather than a sharp bounce from exhaustion. Volatility expanded during the recent selloff, and the price has struggled each time it moved toward the mid-band around $880.
The general trend continues to point downward. Price action is still carving out lower highs and lower lows, and what used to be a solid support around $900 has flipped into a clear resistance.
Momentum is still soft. The relative strength index is holding below the 50 mark, and each bounce has faded quickly. Volume tells a similar story. The most aggressive trading showed up during the breakdown, while buying interest since then has been relatively thin.
Still in negative territory, the MACD remains below the signal line, showing that downside momentum has not faded. On the moving average side, price is trading well below every major short- and medium-term average, from the 10-day through the 200-day.
A move back above $880 could ease pressure and open room toward the $900–$920 range. Failure to hold above $820, however, would keep the downside in play as long as the price stays under key moving averages.


You May Also Like

Fed Governor Calls For Strong Stablecoin Oversight As CLARITY Act’s Final Text Gets Delayed

Pi Network Emphasizes Digital Identity Role as Web3 Adoption Grows


