

Polygon Ecosystem Token (MATIC) Price Prediction 2026–2030: Can MATIC Hit $0.3000 Soon?
- MATIC breakout sparks bullish momentum with potential to reach $0.3000.
- Overbought indicators signal possible consolidation before MATIC’s next significant price extension.
- Long-term growth projections suggest a steady climb toward $0.3000 if key support levels hold.
Polygon Ecosystem Token (MATIC) has entered 2026 with a major bullish breakout, surging above key resistance levels and setting the stage for a potential climb toward $0.3000. Currently trading at $0.1555, MATIC has gained considerable traction, with recent price action showing strong upside momentum. This breakout has propelled the token above the upper Bollinger Band, and momentum indicators point to aggressive buying interest. While short-term conditions are stretched, the broader technical outlook suggests that MATIC may continue its upward trajectory if support levels remain intact.
The rally has reignited interest in the broader altcoin market, and MATIC is currently one of the more technically bullish assets entering 2026. However, the sustainability of this momentum will depend on whether the buyers can maintain the support levels during potential consolidation periods.
Also Read: PEPE (PEPE) Price Prediction 2026–2030: Can PEPE Sustain Its Breakout Rally?
Market Sentiment and Momentum
Market sentiment surrounding MATIC has turned decisively bullish as buyers dominate the daily price action. The size and strength of the breakout candle indicate strong accumulation rather than a fleeting spike, bolstered by rising volatility and increasing market participation.
Despite the current optimism, the volatility of altcoins makes them susceptible to sharp pullbacks after such rapid upward moves. Traders are keeping a close watch on momentum to determine whether MATIC can transition from breakout conditions into a sustained rally or if it faces a consolidation phase before another leg up.
Current Market Overview
As of the latest data, MATIC is trading at $0.1555, with a solid double-digit daily increase. The price has decisively moved above the 20-day simple moving average (SMA), signaling a shift in the short-term trend from neutral to bullish.
This breakout has also seen price action extending beyond the upper Bollinger Band, confirming strong upward momentum. However, sustained trading above the upper band typically leads to a period of consolidation. A pullback or sideways movement above the breakout levels would help solidify the bullish case for MATIC’s continuation.
Technical Analysis
Bollinger Bands
The Bollinger Bands on the daily chart show a sharp upward expansion, highlighting a volatility-driven breakout. Price is currently trading above the upper band, with the 20-day SMA significantly lower, demonstrating the speed of the recent surge.
This setup indicates strong bullish conviction but also suggests that the price may be overstretched in the short term. A period of consolidation near the former upper Bollinger Band around $0.1175 would be a healthy technical development, helping to establish a solid support base for further upside movement.
RSI Behavior
The Relative Strength Index (RSI) has surged to 83.67, placing MATIC firmly in overbought territory. This level of RSI typically signals intense buying activity, but it does not necessarily mean an immediate reversal. During strong trends, RSI can remain elevated for an extended period.
A cooldown in RSI, maintaining levels above the 60–65 range, would indicate sustained bullish momentum. However, a sharp drop below 55 would signal weakening buying pressure and increase the risk of a deeper correction.
Support and Resistance Levels
Immediate support for MATIC lies near $0.1175, which coincides with the breakout zone and the former upper Bollinger Band. If MATIC holds above this level, the bullish structure remains intact. A deeper support level exists around $0.1000, aligning with the 20-day SMA, which serves as a critical zone for trend definition.
On the upside, initial resistance is located at $0.1756, followed by a broader resistance range between $0.1800 and $0.1900. A sustained move above these levels would open the door to higher targets, with $0.3000 being the key goal in the near future.
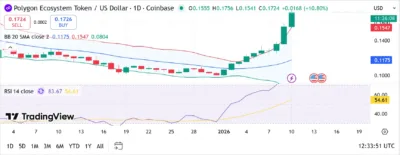
Source: Tradingview
MATIC Price Predictions (2026–2030)
| Year | Minimum Price | Average Price | Maximum Price |
|---|---|---|---|
| 2026 | $0.1350 | $0.1700 | $0.2100 |
| 2027 | $0.1600 | $0.2000 | $0.2500 |
| 2028 | $0.2000 | $0.2500 | $0.3000 |
| 2029 | $0.2400 | $0.3000 | $0.3500 |
| 2030 | $0.2800 | $0.3500 | $0.4200 |
2026
In 2026, MATIC is expected to continue exhibiting high volatility as speculative capital rotates through the altcoin market. If the current breakout structure holds, MATIC could stabilize at higher valuation levels compared to the late 2025 period. With consolidation phases followed by momentum-driven expansions, the key for a bullish continuation will be maintaining support above $0.1175.
2027
By 2027, MATIC could experience more defined uptrends, especially if the broader cryptocurrency market sentiment improves and liquidity conditions strengthen. Increased participation from long-term holders could reduce downside risk during corrective phases, pushing MATIC further toward $0.2500.
2028
In 2028, MATIC may benefit from recurring speculative cycles within the altcoin space. The price could show wider trading ranges, but the general uptrend should continue, with potential to reach or even exceed $0.3000. As liquidity matures, MATIC could become a more stable player in the market, maintaining higher average valuation levels.
2029
As MATIC continues to mature into 2029, it could establish itself as one of the most liquid and well-known altcoins. If adoption and trading activity continue to grow, price could stabilize around $0.3000, with pullbacks likely viewed as buying opportunities.
2030
By 2030, MATIC’s long-term future will largely depend on sustained crypto adoption and the continuation of speculative interest. With favorable market conditions, MATIC could enter a new phase of growth, potentially surpassing $0.3500, as retail participation and trading volumes remain strong.
Conclusion
MATIC enters 2026 in a strong technical position following a decisive breakout above key resistance levels. Although overbought conditions suggest potential short-term consolidation, the broader trend remains bullish as long as MATIC holds above key support zones. If MATIC can continue to build on its current momentum and successfully navigate consolidation periods, a rise toward $0.3000 could be in the cards.
In the long run, continued liquidity, a strong community, and favorable market cycles position MATIC for further growth through 2030, with $0.3000 being a reachable target.
FAQs
1.What is the current market sentiment for MATIC in 2026?
Market sentiment is strongly bullish, with MATIC breaking above key resistance levels and showing aggressive buying interest.
2. Is MATIC currently overbought?
Yes, with an RSI of 83.67, MATIC is in overbought territory, though this is common during strong trend expansions.
3. Can MATIC reach $0.3000 soon?
If MATIC can maintain support above $0.1175 and continue its momentum, it is on track to potentially hit $0.3000 by 2028 or 2029.
4. What are the key levels to watch?
Critical support lies at $0.1175 and $0.1000, while resistance is found near $0.1756 and $0.1900.
5. What is the long-term outlook for MATIC?
With favorable conditions, MATIC could continue growing and may even surpass $0.3500 by 2030
Also Read: BONK (BONK) Price Prediction 2026–2030: Can BONK Sustain Its Breakout Rally?
The post Polygon Ecosystem Token (MATIC) Price Prediction 2026–2030: Can MATIC Hit $0.3000 Soon? appeared first on 36Crypto.


You May Also Like

Bitcoin treasury sell-off accelerates as Riot, Bhutan, and public companies exit positions

Trump vows Middle East deal is on, calls for no more attacks

U.S. Bans Foreign Access to Anthropic’s Most Powerful AI Models After Amazon Security Warning


