

Polygon Price Analysis: Can POL Hold $0.10 Support Level?
This article was first published on The Bit Journal.
Polygon price analysis opens a focused view into POL’s latest market behaviour. Buyers have shown strong interest in a key demand area that traders have been watching for some time, even as overall sentiment in the crypto market remains weak.
Recent price movement suggests a short-term technical bounce rather than a full change in trend, influenced by ongoing token burn activity and Bitcoin’s near-term price direction. The main question ahead is whether this support can hold and build real momentum, or if broader market pressure will limit further gains.
What does the current setup tell traders about Polygon?
Polygon price analysis shows a market moving with caution, where neither buyers nor sellers have taken full control. Since December 2024, Polygon has remained under pressure on higher timeframes, reflecting a wider downward trend. Shorter-term charts tell a more balanced story.
 Polygon Price Analysis: Can POL Hold $0.10 Support Level? 3
Price action has stayed within a clear range, pointing to stability rather than strong momentum in either direction. Analysts often describe such conditions as consolidation. Buyers are still participating, but sellers have not stepped away. That balance helps explain why quick price rebounds have failed to develop into sustained rallies.
Why are buyers defending the lower demand zone?
Buying interest has remained visible around the psychological $0.10 level in recent Polygon price analysis. Polygon traded down to this area at the start of January and returned to it again over the weekend, with buyers stepping in on both occasions.
The demand zone held firm, leading to a 15.25% rebound on Monday, January 2. This reaction showed that market participants were actively defending the level, although analysts continue to note that repeated support tests do not, by themselves, confirm a broader shift in the overall trend.
How do burn metrics shape market sentiment?
Supply dynamics remain an important factor in the latest POL price analysis. During January’s rally, Polygon recorded the burn of 3 million tokens in a single day, highlighting a sharp reduction in supply over a short period.
This trend continued through the month, with a total of 25.7 million POL removed from circulation, making it one of the largest monthly burn figures. Analysts generally see ongoing token burns as supportive for long-term value, but they also point out that reduced supply alone may not be enough to counter weak market sentiment when broader risk assets remain under pressure.
What signals are visible on price and volume charts?
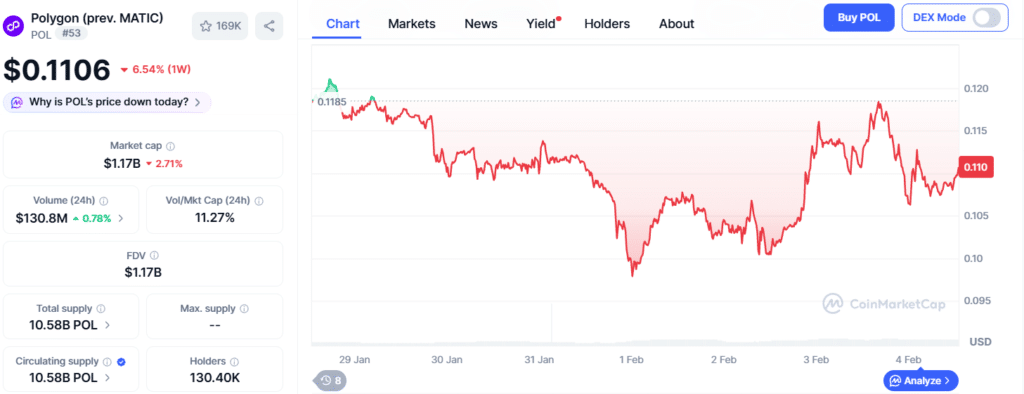
Polygon price analysis indicates a market maintaining its position without decisive momentum. The daily Polygon chart shows trading confined between $0.10 and $0.18 for several weeks. The $0.0987 low faced tests twice within just over a month, holding firm each time as buyers intervened to prevent further declines.
The On-Balance Volume (OBV) indicator did not make new lows, and trading volume remains consistent, reflecting equilibrium between buyers and sellers. Analysts view this pattern as typical consolidation, with the market poised for a potential directional breakout.
How does Bitcoin influence Polygon’s next move?
Polygon price analysis shows that Bitcoin is still a major factor for Polygon. POL’s recent bounce happened when Bitcoin reached around $79k on Monday, but the situation remains uncertain.
Bitcoin is currently at $76,453.26 and facing resistance at $79.4k. Polygon is currently trading around $0.1107, down 2.6% in the last 24 hours and 6.68% over the past week. Traders say that Polygon’s next move will likely follow Bitcoin. Without stronger momentum in Bitcoin, it could be hard for POL to push higher.
Is there room for further upside in the near term?
Short-term POL price analysis highlights key resistance areas to watch. The $0.1325 level has been an important reference in recent weeks, followed by the $0.13 zone, which has acted as a short-term supply area.
 Polygon Price Analysis: Can POL Hold $0.10 Support Level? 4
Moving into this range could attract selling pressure. Traders say that if POL is rejected here, caution is advised, but if it manages to reclaim these levels, it could pave the way toward $0.186. At the moment, however, such a move looks possible but not likely.
Conclusion
Polygon price analysis shows POL oscillating within a familiar range, supported by strong demand at lower levels but constrained by market-wide uncertainty. Long-term holders may draw confidence from the repeated defense of key support and consistent token burns.
Short-term traders, however, remain focused on reactions near supply zones and Bitcoin’s next move. Until broader conditions improve, Polygon’s price action appears more reflective than reactive, waiting for a decisive signal before committing to a clear direction.
Glossary
Polygon (POL): A network that helps Ethereum run faster and at lower cost.
Demand Zone: A price level where buyers step in to support the asset.
Token Burn: A process that reduces supply by permanently removing tokens.
Consolidation: A phase where price moves sideways within a set range.
Trading Volume: The amount of an asset traded over a given period.
Frequently Asked Questions About Polygon Price Analysis
Why is the $0.10 level important for POL?
The $0.10 level is important because buyers are actively buying POL at this price.
Did POL recently bounce from $0.10?
Yes, POL bounced about 15% after buyers defended the $0.10 demand zone.
What price range is POL trading in?
POL has mostly traded between $0.10 and $0.18 in recent weeks.
Do token burns guarantee a price increase?
No, token burns can help long-term value but do not guarantee higher prices.
How does Bitcoin affect POL’s price?
Bitcoin’s price strongly influences Polygon price analysis and can limit or support its moves.
Sources
AMBCrypto
CoinMarketCap
Read More: Polygon Price Analysis: Can POL Hold $0.10 Support Level?">Polygon Price Analysis: Can POL Hold $0.10 Support Level?


You May Also Like

Tokenized deals incoming? Franklin Templeton experiments with blockchain-based M&A

Today’s Biggest Crypto Movers: Dogecoin Leads the Pack


