

Deep Pullback in a Bearish Context for Bitcoin Price Today (BTC/USDT Analysis)

Markets are processing a controlled yet persistent selloff as Bitcoin price today trades in a zone where bearish momentum meets growing contrarian interest.
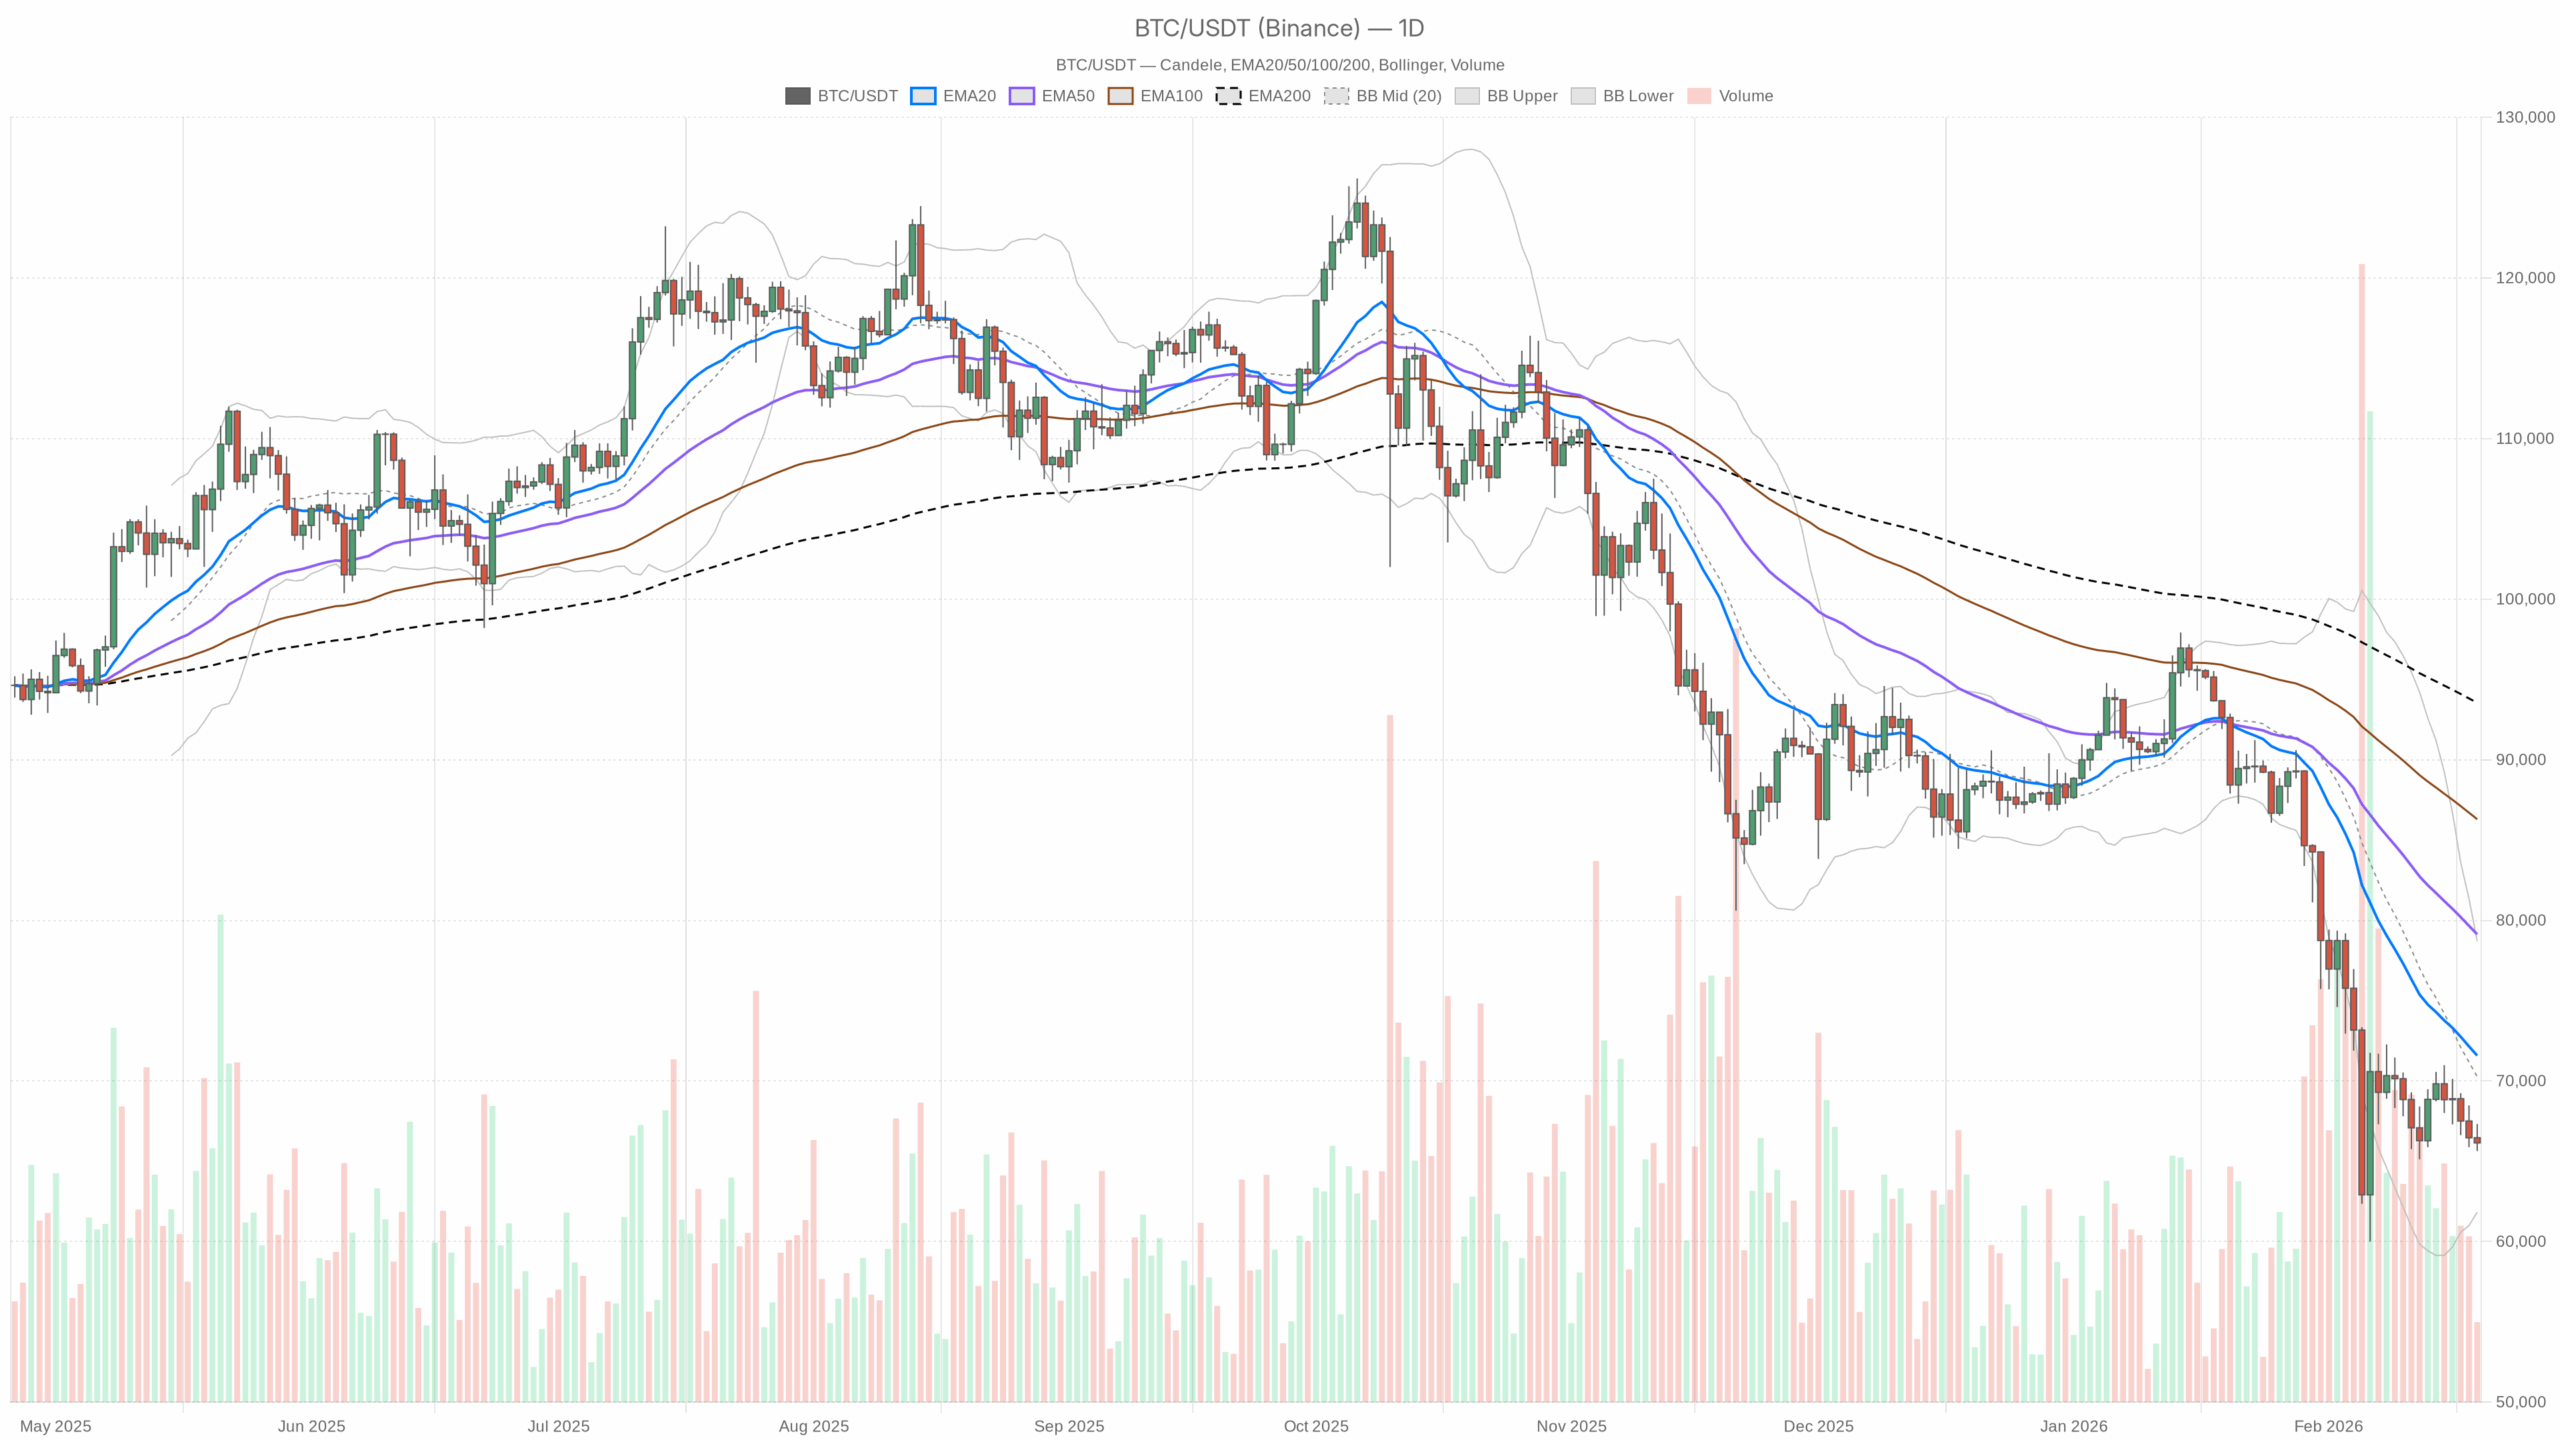 BTC/USDT — daily chart with candlesticks, EMA20/EMA50 and volume.
1. Market Thesis – Where We Stand Now
Bitcoin price today is trading around $66,100–66,200 (BTC/USDT) after several weeks of controlled but persistent selling. The daily trend is clearly bearish, but what matters here is how we are selling off: it has been steady, not panic-driven, and we are now entering levels where the market usually starts to argue with itself.
The dominant force right now is risk-off positioning from larger players after the Wall Street-driven ETF wave cooled and macro/geopolitical tension picked up. You see that in the headlines, but you also see it in structure: price is well below the major moving averages, RSI is depressed but not yet washed out, and the fear & greed index is sitting at Extreme Fear (9). This is the part of the cycle where trend followers are still short or flat, while contrarians are quietly starting to plan entries, not because things look good, but because things finally look uncomfortable.
2. Higher Timeframe Bias (Daily – D1)
On the daily chart, the system labels the regime as bearish. The burden of proof is on the bulls.
Price vs EMAs (Trend Structure)
- Close: $66,139.49
- EMA 20: $71,578.15
- EMA 50: $79,127.61
- EMA 200: $93,541.55
Price is trading well below all three EMAs. Short-term trend (20 EMA), medium-term trend (50 EMA), and long-term trend (200 EMA) are all above price and effectively acting as a stacked zone of overhead supply.
What it implies: Structurally, we are in a mature pullback within a larger-cycle bull market. You do not get price that far below a rising 200 EMA in the middle of a euphoric blow-off; you see it during deeper corrections where late longs are being cleaned out. The distance to the 20 and 50 EMAs means any bounce has room to run before it even threatens the broader down-leg.
RSI (Momentum / Exhaustion)
- RSI 14 (Daily): 32.44
Daily RSI is sitting just above classical oversold territory.
What it implies: Momentum is bearish but not yet capitulative. Sellers are in control, but we are entering a zone where fresh shorts carry higher risk of getting squeezed. It is the kind of reading where the trend can push a bit lower, but the risk-reward starts shifting against newly established aggressive shorts unless we see another sharp leg down.
MACD (Trend Momentum & Inflection)
- MACD line: -4,597.9
- Signal line: -4,926.81
- Histogram: +328.91
MACD is negative, in line with the downtrend, but the histogram is positive, meaning the MACD line is starting to creep back toward the signal line.
What it implies: Trend momentum is still down, yet the rate of downside is easing. Bears are no longer accelerating the move; they are pressing an existing advantage. This is often how bases or short-term relief rallies begin: not with instant reversals, but with a loss of downside momentum first.
Bollinger Bands (Volatility & Location)
- Middle band (20 SMA proxy): $70,266.69
- Upper band: $78,702.41
- Lower band: $61,830.96
- Price (close): $66,139.49
Bitcoin is trading in the lower half of the bands, but not pinned to the lower band.
What it implies: We are in a downside-biased volatility regime, but without a full volatility blowout. Price is not hugging the lower band, which tells you we are not in the straight-line liquidation phase. There is still room for a push toward the lower band near $61.8k if sentiment worsens, but also room for mean reversion back toward the mid-band around $70k if sellers lose focus.
ATR (Daily Volatility)
- ATR 14: $3,599.87
Daily ATR is about $3.6k, which is elevated but not extreme by Bitcoin standards.
What it implies: We are in a high but manageable volatility environment. Daily ranges around 5–6% are on the table. Position sizing needs to assume that a $3–4k intraday swing is routine, not exceptional.
Daily Pivot Levels
- Pivot Point (PP): $66,363.77
- Resistance 1 (R1): $67,095.72
- Support 1 (S1): $65,407.55
Price is sitting just under the daily pivot point.
What it implies: Short-term control is in the hands of sellers as long as price stays below $66.4k. The pivot acts as an intraday line in the sand: reclaiming it with momentum would hint at a short-covering day, while repeated rejections keep the path open toward $65.4k and below.
3. Intraday Context – H1 and M15
Hourly (H1) – Confirming the Downtrend
- Close: $66,148
- EMA 20: $66,716.85
- EMA 50: $67,161.95
- EMA 200: $68,157.46
- RSI 14: 37.35
- MACD line: -238.59
- MACD signal: -190.63
- MACD hist: -47.96
- BB mid: $66,626.86 • upper: $67,322.41 • lower: $65,931.31
- ATR 14: $395.62
- Pivot PP: $66,000.12 • R1: $66,368.4 • S1: $65,779.71
On H1, price is also below all key EMAs, and the regime is flagged as bearish. RSI is weak but not oversold, and the MACD histogram is slightly negative.
What it implies: The hourly chart is aligned with the daily downtrend. Sellers are still leaning on intraday rallies, but momentum is not in free fall. The hourly ATR near $400 means intraday swings around 0.5–0.7% are typical, and the hourly pivot at $66k is acting as a gravitational point. Brief spikes above the pivot that fail near R1 around $66.37k are classic spots where short-term traders re-join the prevailing downtrend.
15-Min (M15) – Execution Layer
- Close: $66,125.34
- EMA 20: $66,423.36
- EMA 50: $66,656.87
- EMA 200: $67,192.10
- RSI 14: 35.93
- MACD line: -236.28
- MACD signal: -178.2
- MACD hist: -58.08
- BB mid: $66,513.08 • upper: $67,212.48 • lower: $65,813.68
- ATR 14: $256.4
- Pivot PP: $65,992.56 • R1: $66,353.3 • S1: $65,764.61
M15 shows price grinding under its short EMAs with soft downside momentum. RSI is weak, and the MACD histogram is negative but not collapsing.
What it implies: The microstructure is controlled selling rather than panic. Dips are being sold, but bounces are not completely dead. For intraday traders, the band between the 15-minute pivot around $65,993 and R1 near $66,353 is a short-term battlefield: above R1 you start to see evidence of a squeeze; below the pivot the path of least resistance stays lower toward $65.7k and then the daily S1 region.
4. Market Context: Dominance, Sentiment, and DeFi
BTC dominance is high at 56.18%, while total crypto market cap is down about 1.7% in 24 hours. Fear & Greed sits at 9 (Extreme Fear).
What it implies: Money is not rotating into altcoins; it is either sitting in BTC, moving to stablecoins, or leaving the space entirely. Extreme fear at these levels usually appears in the later stages of a drawdown rather than the beginning. It does not guarantee a bottom, but it tells you that forced sellers and late bears are increasingly driving the tape. DeFi fee spikes on major DEXs, for example Uniswap v3 up sharply on the day, point to heightened on-chain activity, consistent with repositioning and de-risking.
5. Main Scenario for Bitcoin Price Today
Based on the daily trend structure and aligned lower timeframes, the main scenario is bearish. However, it is a late-stage bearish environment characterized by momentum loss and elevated fear, which is typically where inflection setups start to form.
Bearish Scenario (Primary)
In the active bearish path, Bitcoin fails to reclaim the daily pivot at about $66.4k with authority. Every test of that area and the nearby hourly resistance band around $67k is met with selling. H1 and M15 EMAs continue to cap price, and the market grinds lower in a stair-step pattern.
Under this scenario:
- Intraday, the H1 S1 near $65.78k and daily S1 at about $65.41k levels get tested and potentially broken.
- Volatility (ATR) keeps daily ranges large enough to threaten the lower Bollinger Band near $61.8k.
- RSI can sink into the 25–30 zone on the daily if we see a clean leg toward or slightly through $60k, aligning with the recent news narrative about liquidation triggers around that level.
What strengthens this scenario today: staying pinned below the cluster of intraday EMAs, more negative MACD histograms on H1 and M15, and any pickup in daily ATR without positive reaction from buyers.
Bearish scenario invalidation:
- A sustained move back above $70k, roughly the daily mid Bollinger and near the 20 EMA, would seriously damage the immediate bearish thesis.
- On lower timeframes, a series of higher highs and higher lows on H1 above the $66.5–67k band, accompanied by MACD crossing firmly positive and RSI pushing through the mid-50s, would signal that sellers have lost control of the short-term tape.
Bullish / Mean-Reversion Scenario (Secondary)
The counter-scenario takes the view that extreme fear plus slowing downside momentum is setting up a relief rally rather than another waterfall. Here, Bitcoin defends the mid-$65k area and begins to grind higher intraday.
Under this path:
- Price reclaims the daily pivot at $66.4k and holds above it on a closing basis.
- The first upside magnet is the hourly mid-Bollinger and EMAs around $66.7–67.2k, followed by the daily mid-Bollinger near $70k.
- Daily RSI moves back above 40, and the MACD histogram on D1 stays positive and grows, signaling a more convincing slowdown of the prior downtrend.
This scenario is not about calling a new macro bull leg; it is about pricing in a short-covering rally and perhaps a retest of broken support levels from above.
Bullish scenario invalidation:
- A clean break and daily close below the lower Bollinger trajectory, around $61.8k, or a fast flush toward $60k without strong buying reaction would undercut the mean-reversion idea and reopen the door for a deeper correction.
- If H1 repeatedly fails at the $66–67k zone and rolls over with rising volume, the bounce case weakens quickly.
Neutral / Range-Building Variant
There is a realistic middle path: Bitcoin could simply start building a range between roughly $62k and $70k, with volatility compressing over time. In that case, daily EMAs would gradually drift down while price chops sideways, and indicators like RSI would hover in the 40–50 area.
What would support this: declining ATR, flat-to-slightly positive MACD histogram, and a series of failed breakouts and breakdowns on both sides of the range.
6. Positioning, Risk, and Uncertainty
The current setup is one where trend followers still have the edge, but their edge is diminishing as momentum cools and sentiment hits extreme fear. The daily structure supports a bearish bias, yet the indicators are clear: this is not the start of the downtrend; it is the more mature phase where late shorts and forced liquidations tend to battle with early dip buyers.
For any active approach, the key is timeframe alignment:
- If you lean into the bearish view, you want H1 and M15 to remain capped by their EMAs and pivots, with daily staying below $70k. Sharp squeezes into those moving averages are the high-risk zones to manage.
- If you are watching for a bounce, your first confirmation is the ability of price to reclaim and hold above pivots, today around $66–66.5k, and then start closing candles above the short EMAs on H1.
Volatility is high enough that position sizing and liquidity choice matter more than usual. A move of $3–4k either way in a session is well within the normal range right now, so any plan built on tight stops or over-leverage is effectively a bet on noise, not direction.
Above all, this is an environment where narratives shift quickly. A move from extreme fear to reluctant optimism can happen in a handful of sessions if price bounces hard, just as another wave of macro risk-off could push BTC toward the $60k liquidation pocket. The only constant here is uncertainty, so any directional stance needs to be paired with clear invalidation levels and respect for the current volatility regime.


You May Also Like

US and Israeli strikes on Iran halt nuclear deal talks

Timberwolves’ Star Edwards Exits Game With Knee Injury; DiVincenzo Suffers Torn Achilles


