

Cardano’s Chart Just Printed a “Black 9” – Here’s Where ADA Price Could Go Next
Sometimes the loudest signals come from the quietest charts. The rest of the crypto market watches Bitcoin and its price behavior, but Cardano just flashed a technical setup that has historically preceded meaningful moves.
Ali Martinez, a well-known crypto analyst on X, posted a weekly chart of Cardano that shows the TD Sequential indicator printing a “black 9.” For those who follow technical analysis, that’s a signal worth paying attention to.
What the TD Sequential Signal Means
The TD Sequential is a indicator designed to identify points of trend exhaustion and potential price reversals. When it flashes a “black 9” on a weekly timeframe, it suggests the current downtrend has run out of steam.
Martinez shared the chart showing ADA price action from early February through mid-March 2026. The price grinds down from around $0.41 to test support near $0.23. That’s where the “black 9” appears.
According to his analysis, this setup typically anticipates one to four weeks of upward expansion. In plain English: the selling pressure that pushed Cardano down for months may finally be exhausted, and buyers could step in.
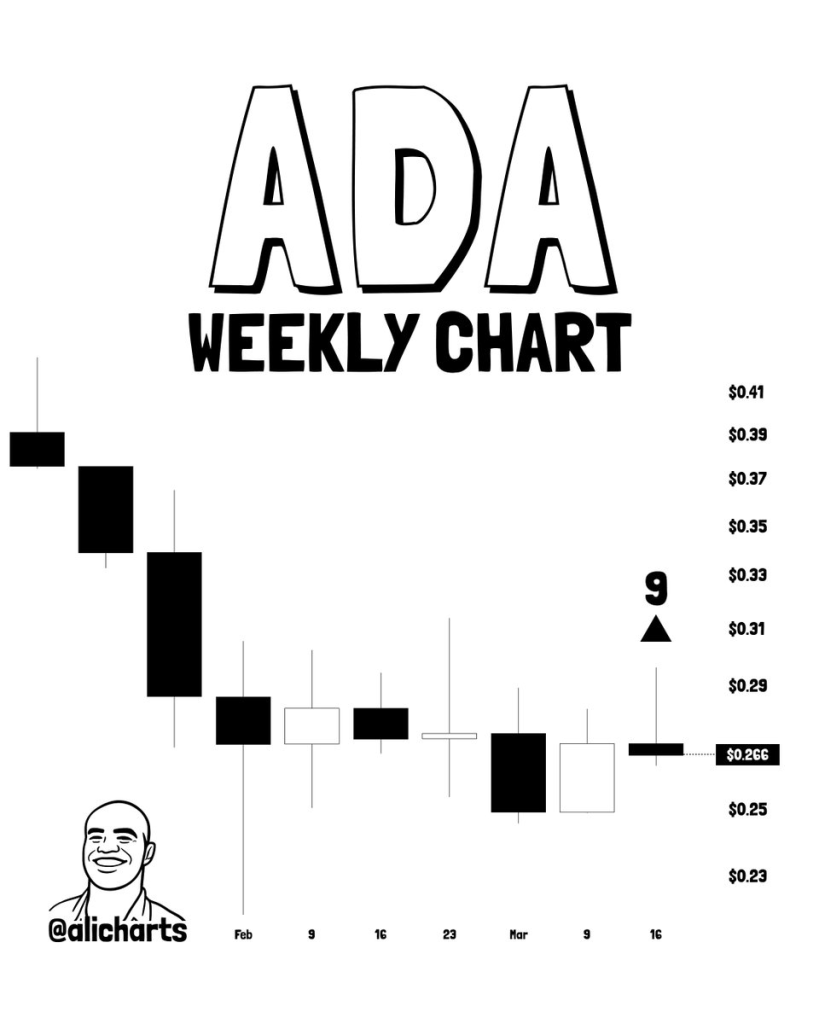 Source: X/@alicharts
The blueprint Martinez lays out is clean:
- Validation: ADA must hold the $0.23 support level on a weekly close
- Targets: A successful rebound puts $0.32 and $0.37 in focus
- Risk: A break below $0.23 invalidates the setup completely
Where the ADA Price Goes From Here
The Cardano price sits at a critical juncture. After six months of grinding lower, holders have been tested. The “black 9” offers hope, but hope alone doesn’t move markets.
If ADA holds $0.23 and starts climbing, the first target is $0.32. That’s about a 28% move from current levels. Above that, $0.37 comes into play; roughly 48% higher.
But here’s the honest take: signals like this work until they don’t. The TD Sequential has correctly called reversals many times, but no indicator is perfect. The weekly close matters. If Cardano loses $0.23 on a weekly basis, the setup fails and the next support levels could come into play.
Martinez sums it up well: “We’ve survived the 6-month grind; now we watch for a potential price recovery.”
For ADA holders, the message is simple. The signal is there. The levels are clear. Now the market has to prove it can follow through.
Read also: DeepSeek AI Predicts the Price of Solana, Cardano and Dogecoin by The End of 2026
Subscribe to our YouTube channel for daily crypto updates, market insights, and expert analysis.
The post Cardano’s Chart Just Printed a “Black 9” – Here’s Where ADA Price Could Go Next appeared first on CaptainAltcoin.


You May Also Like

EUR/GBP Exchange Rate Surges as Bank of England Rate Hike Expectations Intensify – Market Analysis
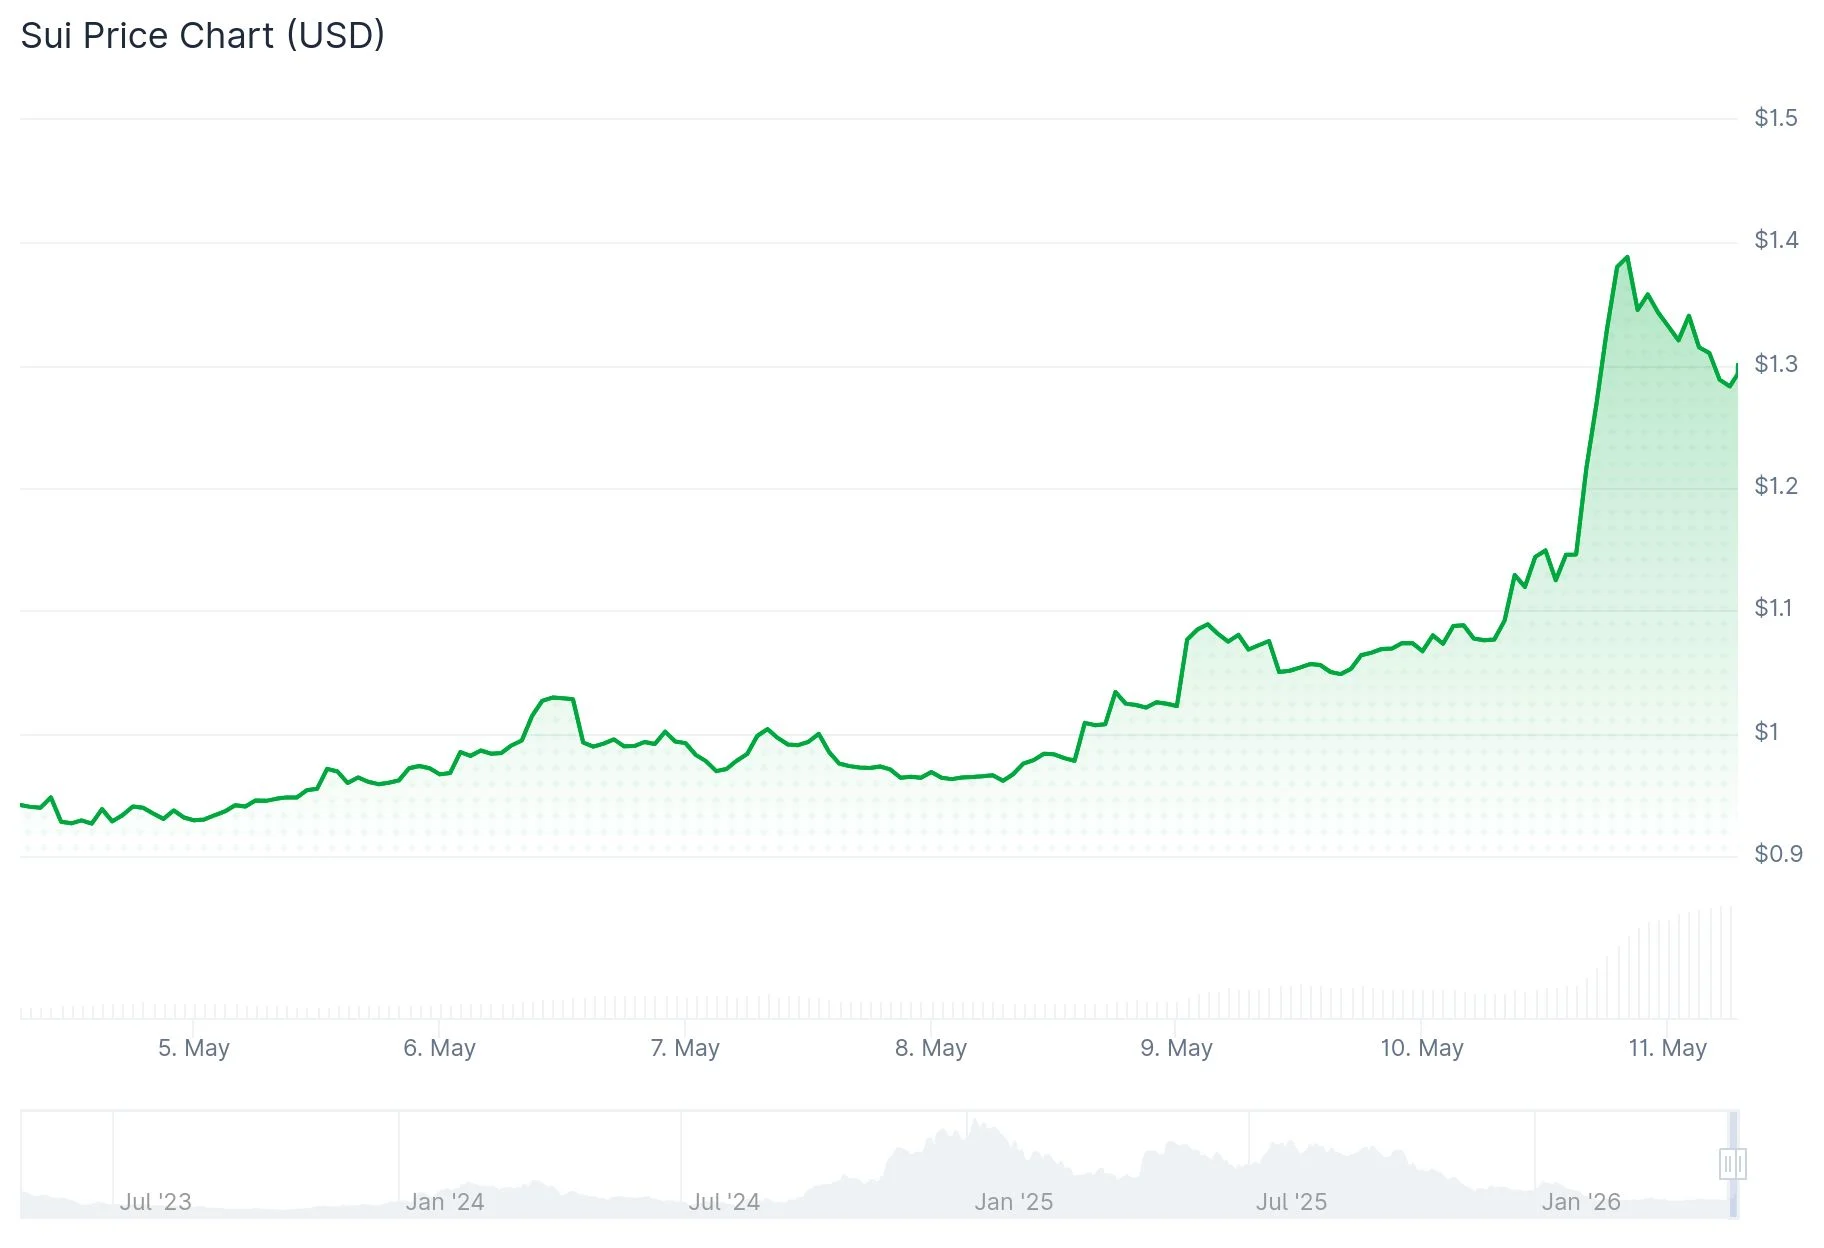
Sui (SUI) Token Rockets 50% Weekly on Institutional Staking and Privacy Tech Rollout


