Dogecoin (DOGE) Consolidates Below $0.10, Breakout Still Elusive
Dogecoin started a recovery wave above the $0.0915 zone against the US Dollar. DOGE is now facing hurdles near $0.0930 and might struggle to continue higher.
- DOGE price started a recovery wave from $0.0890 and climbed above $0.0920.
- The price is trading above the $0.09150 level and the 100-hourly simple moving average.
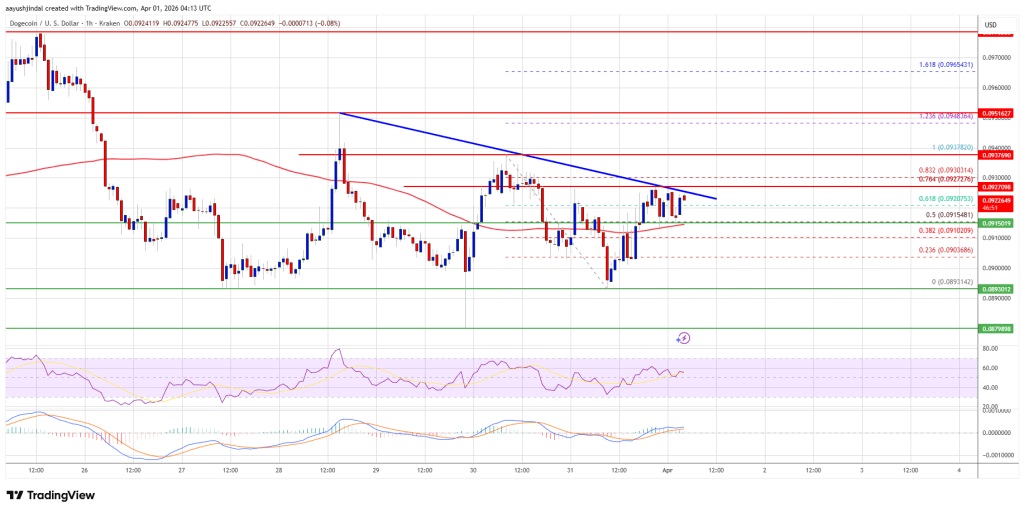
- There is a bearish trend line forming with resistance at $0.0928 on the hourly chart of the DOGE/USD pair (data source from Kraken).
- The price could continue to move up if it stays above $0.090.
Dogecoin Price Hits Resistance
Dogecoin price started a recovery wave from the $0.0890 zone, like Bitcoin and Ethereum. DOGE climbed above the $0.0905 and $0.09120 resistance levels.
There was a decent upward move above the 50% Fib retracement level of the downward move from the $0.0937 swing high to the $0.0893 low. However, the bears remained active near the $0.0930 zone. Besides, there is a bearish trend line forming with resistance at $0.0928 on the hourly chart of the DOGE/USD pair.
Dogecoin price is now trading above the $0.0912 level and the 100-hourly simple moving average. If there is another recovery wave, immediate resistance on the upside is near the $0.09280 level, the trend line, and the 76.4% Fib retracement level of the downward move from the $0.0937 swing high to the $0.0893 low.
The first major resistance for the bulls could be near the $0.0930 level. The next major resistance is near the $0.0950 level. A close above the $0.0950 resistance might send the price toward the $0.0980 resistance. Any more gains might send the price toward the $0.10 level. The next major stop for the bulls might be $0.1020.
Another Decline In DOGE?
If DOGE’s price fails to climb above the $0.0930 level, it could continue to move down. Initial support on the downside is near the $0.0915 level. The next major support is near the $0.090 level.
The main support sits at $0.0885. If there is a downside break below the $0.0885 support, the price could decline further. In the stated case, the price might slide toward the $0.0860 level or even $0.0835 in the near term.
Technical Indicators
Hourly MACD – The MACD for DOGE/USD is now losing momentum in the bullish zone.
Hourly RSI (Relative Strength Index) – The RSI for DOGE/USD is now above the 50 level.
Major Support Levels – $0.0900 and $0.0885.
Major Resistance Levels – $0.0930 and $0.0950.


You May Also Like

Trumps greeted with audible boos at Kennedy Center

How The Children’s Movie “Cars” Forewarns A Post-Human Era