Bitcoin fell below 110,000, 900 million funds were liquidated, is the September curse coming early?
By BitpushNews
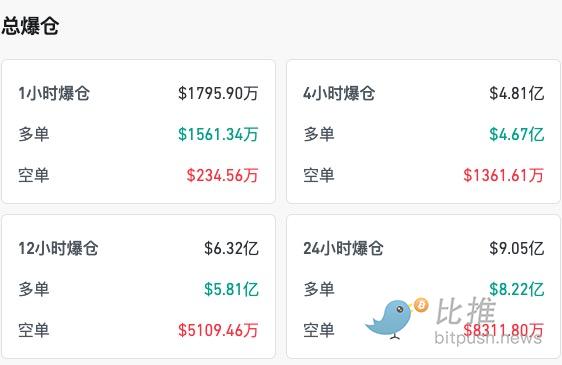
Crypto market volatility intensified on Monday. Bitcoin briefly dipped below $110,000, hitting a low of $109,324, its lowest point since early July. Ethereum also briefly fell below $4,400, a 24-hour drop of nearly 8%. This decline triggered massive liquidations across the market: According to CoinGlass data, as of this writing, 24-hour liquidations exceeded $900 million, with Ethereum longs losing approximately $322 million and Bitcoin longs $207 million.
The market chain reaction was rapid, and mainstream altcoins were under pressure across the board: Solana plummeted by more than 8% in a single day, XRP fell by 6%, and small and medium-sized market capitalization tokens such as PENDLE, LDO, and PENGU recorded double-digit declines, with a single-day drop of as much as 13%.
Historical Patterns: The September Curse
Investors’ caution is not without reason. Statistics from CoinGlass show that September was one of the worst performing months for Bitcoin and Ethereum.
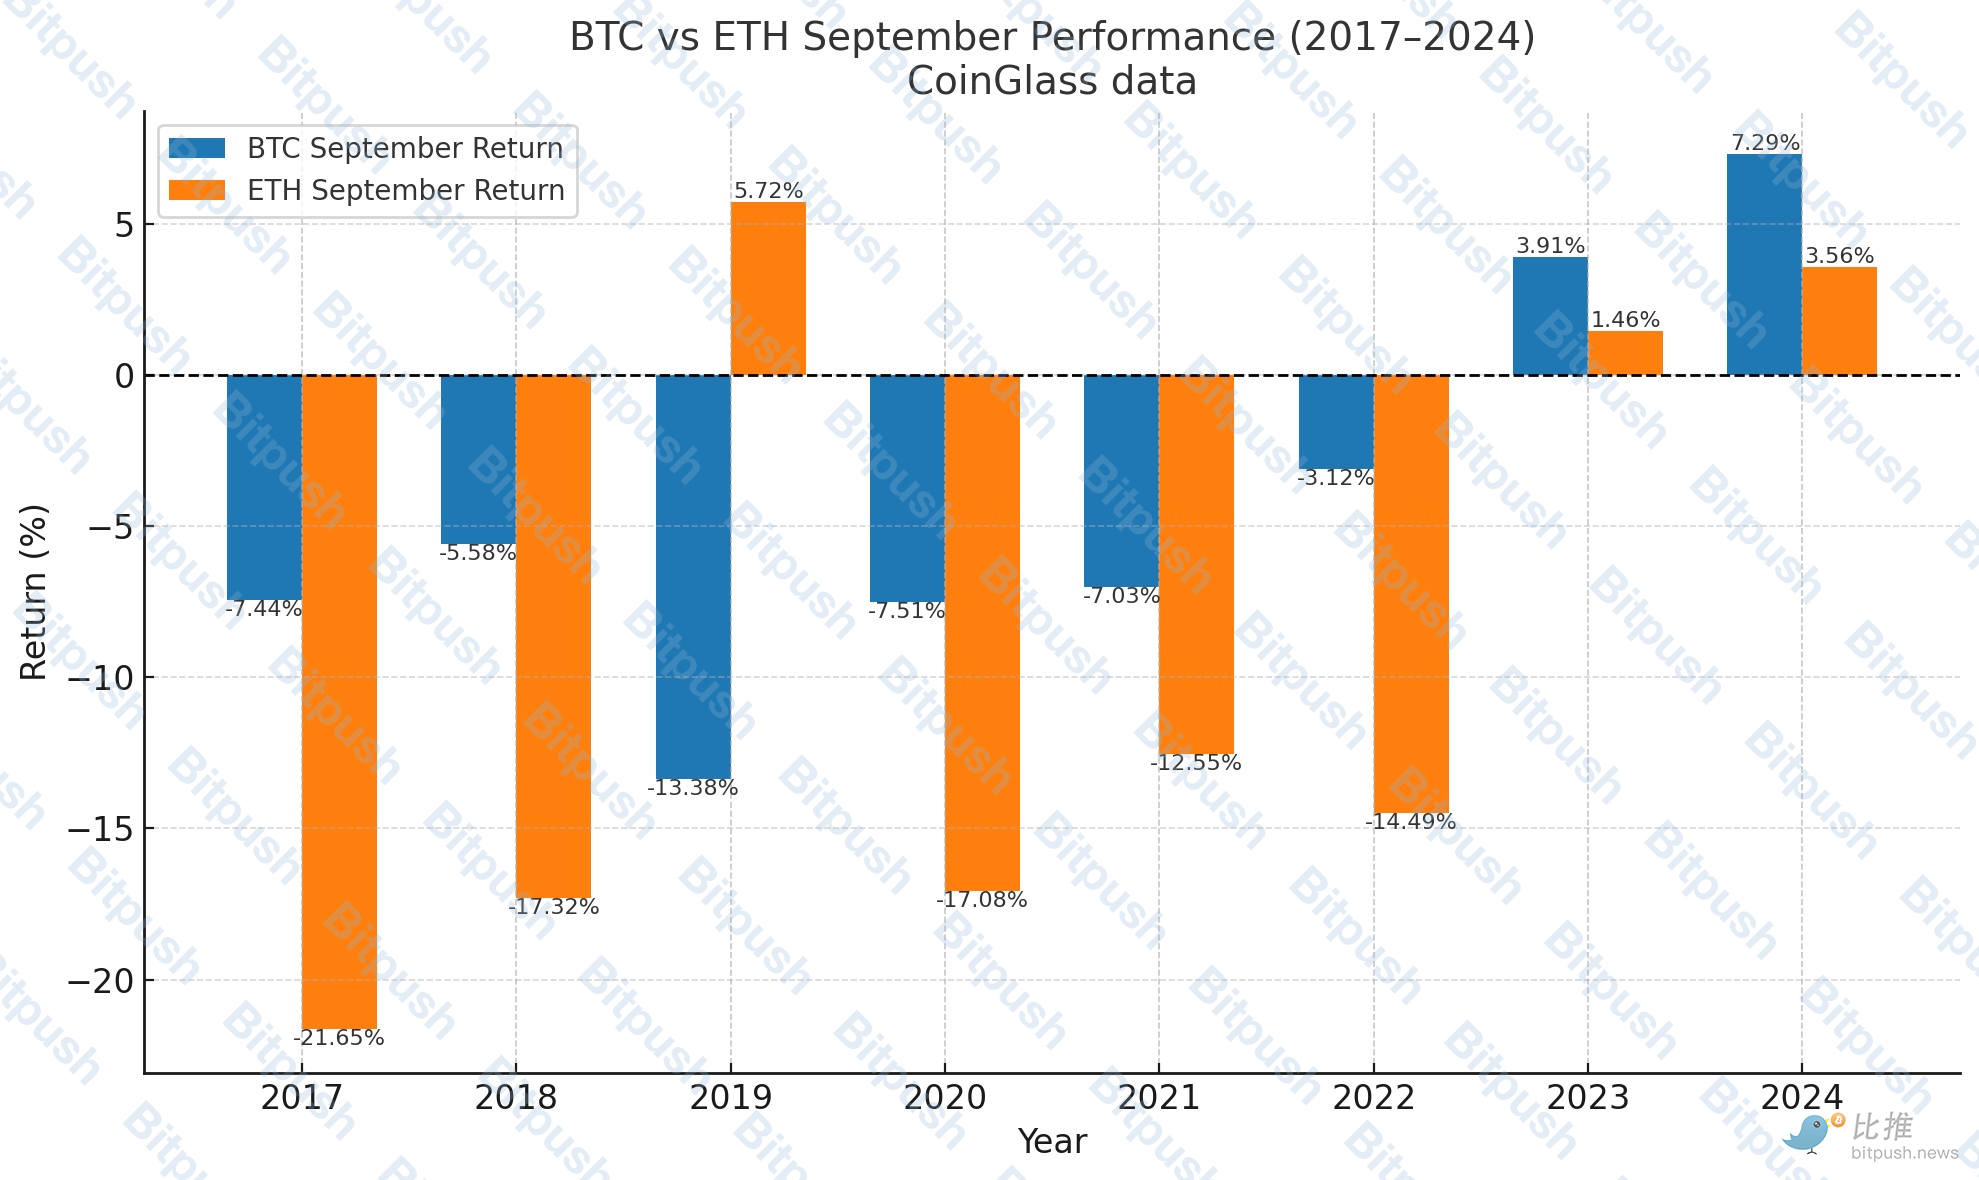
The chart above compares the actual rise and fall of BTC and ETH in September from 2017 to 2024. It can be seen that:
- BTC performed negatively in September in most years, with only 2023 (+3.91%) and 2024 (+7.29%) recording increases.
- ETH’s September decline is usually larger, with 2017 (–21.65%), 2020 (–17.08%), and 2022 (–14.49%) all significantly underperforming BTC.
- Only in 2019 (ETH +5.72% vs BTC –13.38%), 2023 and 2024 did ETH perform better.
This "September curse" has appeared in every bull market cycle. In 2013, 2017, and 2021, Bitcoin experienced a sharp pullback in September after a strong rebound in the summer.
Analyst view: Short-term trend reversal
Renowned analyst Benjamin Cowen noted that strong performances in July and August often reverse in September, and Bitcoin is likely to fall to its bull market support band near $110,000. He also warned that Ethereum could briefly reach a new high before falling 20-30%, and altcoins could even see declines of 30-50%.
Doctor Profit, another active market analyst, offered a more pessimistic assessment from a macro and psychological perspective. He believes the Fed's September rate cut is more of a trigger for uncertainty than a positive development. Unlike the "soft landing" rate cut in 2024, this one could be a true "major turning point," triggering a simultaneous correction in both the stock and crypto markets.
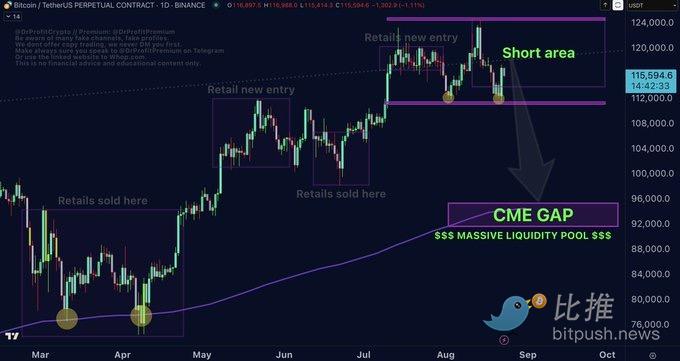
Regarding price, he also emphasized that the CME gap between 93k and 95k still exists on the BTC chart, where a significant amount of liquidity is concentrated, while retail investors generally enter positions in the 110k to 120k range or even higher. To flush out these "weak hands," the price must fall into their "maximum pain point range."
In his strategy, he said he has gradually reduced his positions in BTC and ETH spot and turned to short-term short positions.
The latest fund flow data suggests that the enthusiasm for ETFs is cooling. According to SoSoValue, last week, spot Bitcoin ETFs saw $1.17 billion in outflows, the second-largest weekly net outflow on record; spot Ethereum ETFs saw $237.7 million in outflows, the third-largest on record. This suggests that institutional funds are temporarily shifting to a wait-and-see approach, weakening support for the spot market.
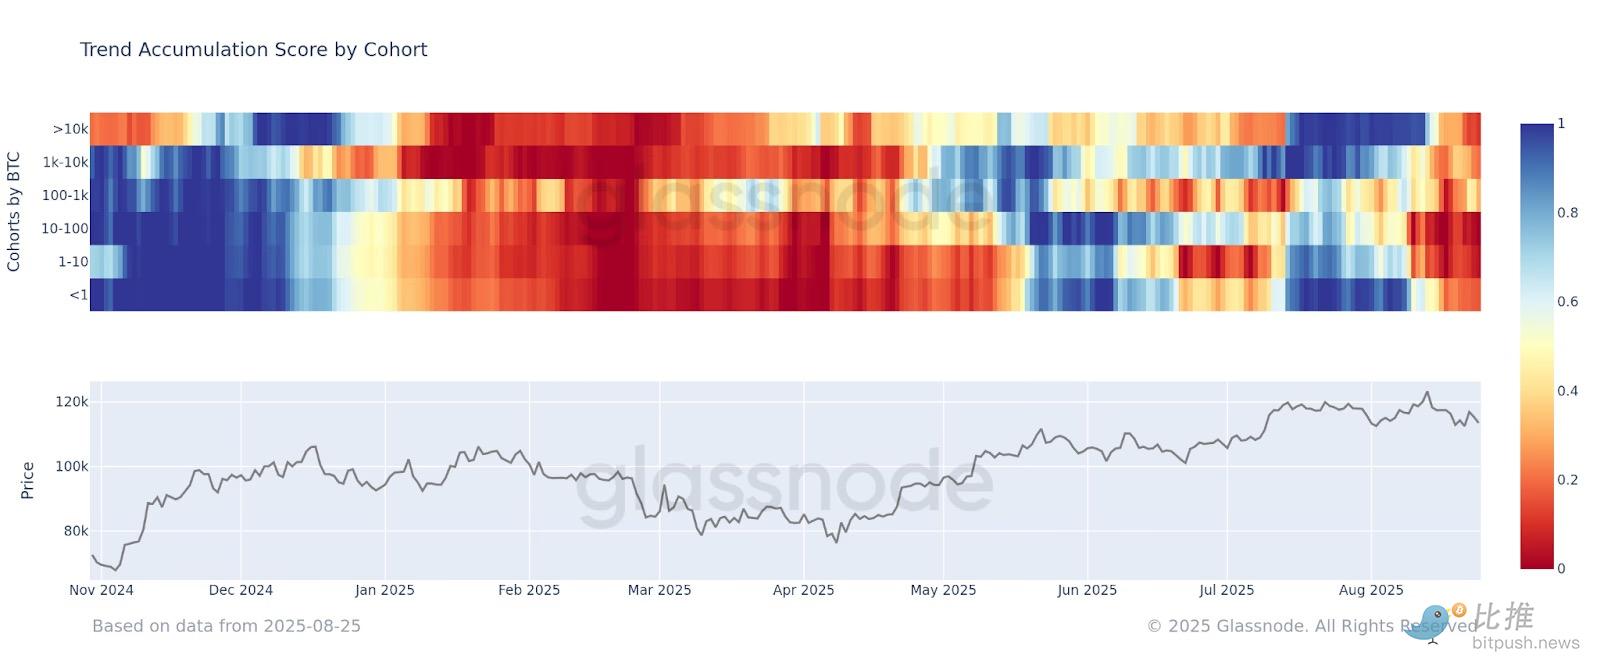
On-chain data also reveals structural signals. Glassnode notes that all groups of Bitcoin holders have "collectively entered the distribution phase," a consistent pattern that highlights widespread selling pressure in the market. Ethereum, after hitting a new high of $4,946, retreated, with the MVRV indicator rising to 2.15, meaning the average investor holds over 2x unrealized gains. Historically, this level is similar to December 2020 and March 2024, both of which preceded significant volatility and profit-taking.
Macroeconomic factors: The Federal Reserve and interest rate risk
Macroeconomic uncertainty has further exacerbated market tensions. Last Friday, Federal Reserve Chairman Powell hinted at a possible rate cut in September, spurring market optimism. However, both Cowen and Doctor Profit cautioned that rate cuts are not necessarily positive and could actually lead to an increase in long-term Treasury yields, suppressing risk assets. This is similar to the situation in September 2023, when a rate cut marked a low in the bond market, followed by a surge in yields. Furthermore, Benjamin Cowen noted that recent Producer Price Index (PPI) data showed inflation "running hotter than expected," undoubtedly adding additional pressure to the market. Without fully easing inflationary pressures, a Fed policy shift could trigger renewed market volatility.
Outlook and Conclusion
Looking at historical patterns, analyst opinions, and the macro environment, we can see that September put several pressures on the crypto market:
- Seasonal downturn – September historically averages significant losses;
- Macro uncertainty – the Fed’s policy could become a watershed moment for the market;
- Imbalanced capital structure - institutional funds outflow, retail investors chasing high prices;
- On-chain selling pressure intensifies - all coin holding groups enter distribution, and whale transactions disrupt the market.
Although Cowen and Doctor Profit have different views on the extent of the adjustment, the consensus is that September is not the time for the bull market to turn upward, but a test that must be faced.
However, from a longer-term perspective, this cleansing may also be a necessary step for the bull market to continue. The market needs to clear out overheated positions in the "greatest pain points" to make room for the next round of gains. If the cleansing is thorough, BTC may still hit new highs in subsequent cycles, and ETH's long-term upward trend will not be altered.
You May Also Like

Microsoft Corp. $MSFT blue box area offers a buying opportunity

Sunrun Shares Plunge 28% Following Disappointing 2026 Cash Flow Forecast