

How to Use the MACD Indicator in Trading: A Complete Beginner's Guide
Key Takeaways
- Moving Average Convergence Divergence, or MACD, is a trend-following momentum indicator made up of the MACD line, signal line, and histogram.
- Three common ways to interpret MACD are line crossovers, zero-line crossovers, and divergence between price and the indicator.
- The standard MACD setting is 12, 26, and 9 periods. Traders may adjust these parameters according to their timeframe and trading style.
- MACD is a lagging indicator based on historical price data. It should be used with tools such as RSI, support and resistance, and volume.
- MACD can be added directly to candlestick charts on MEXC to support Spot and Futures market analysis.
1. What Is the MACD Indicator?
Moving Average Convergence Divergence, or MACD, is a trend-following momentum indicator developed by Gerald Appel in the late 1970s. It compares two exponential moving averages with different periods to help traders evaluate trend direction, momentum, and potential changes in market conditions.
Because MACD combines trend and momentum information in a visual format, it is widely used across financial markets. On MEXC, users can add MACD to both Spot and Futures trading charts and begin analyzing the indicator with its standard settings.
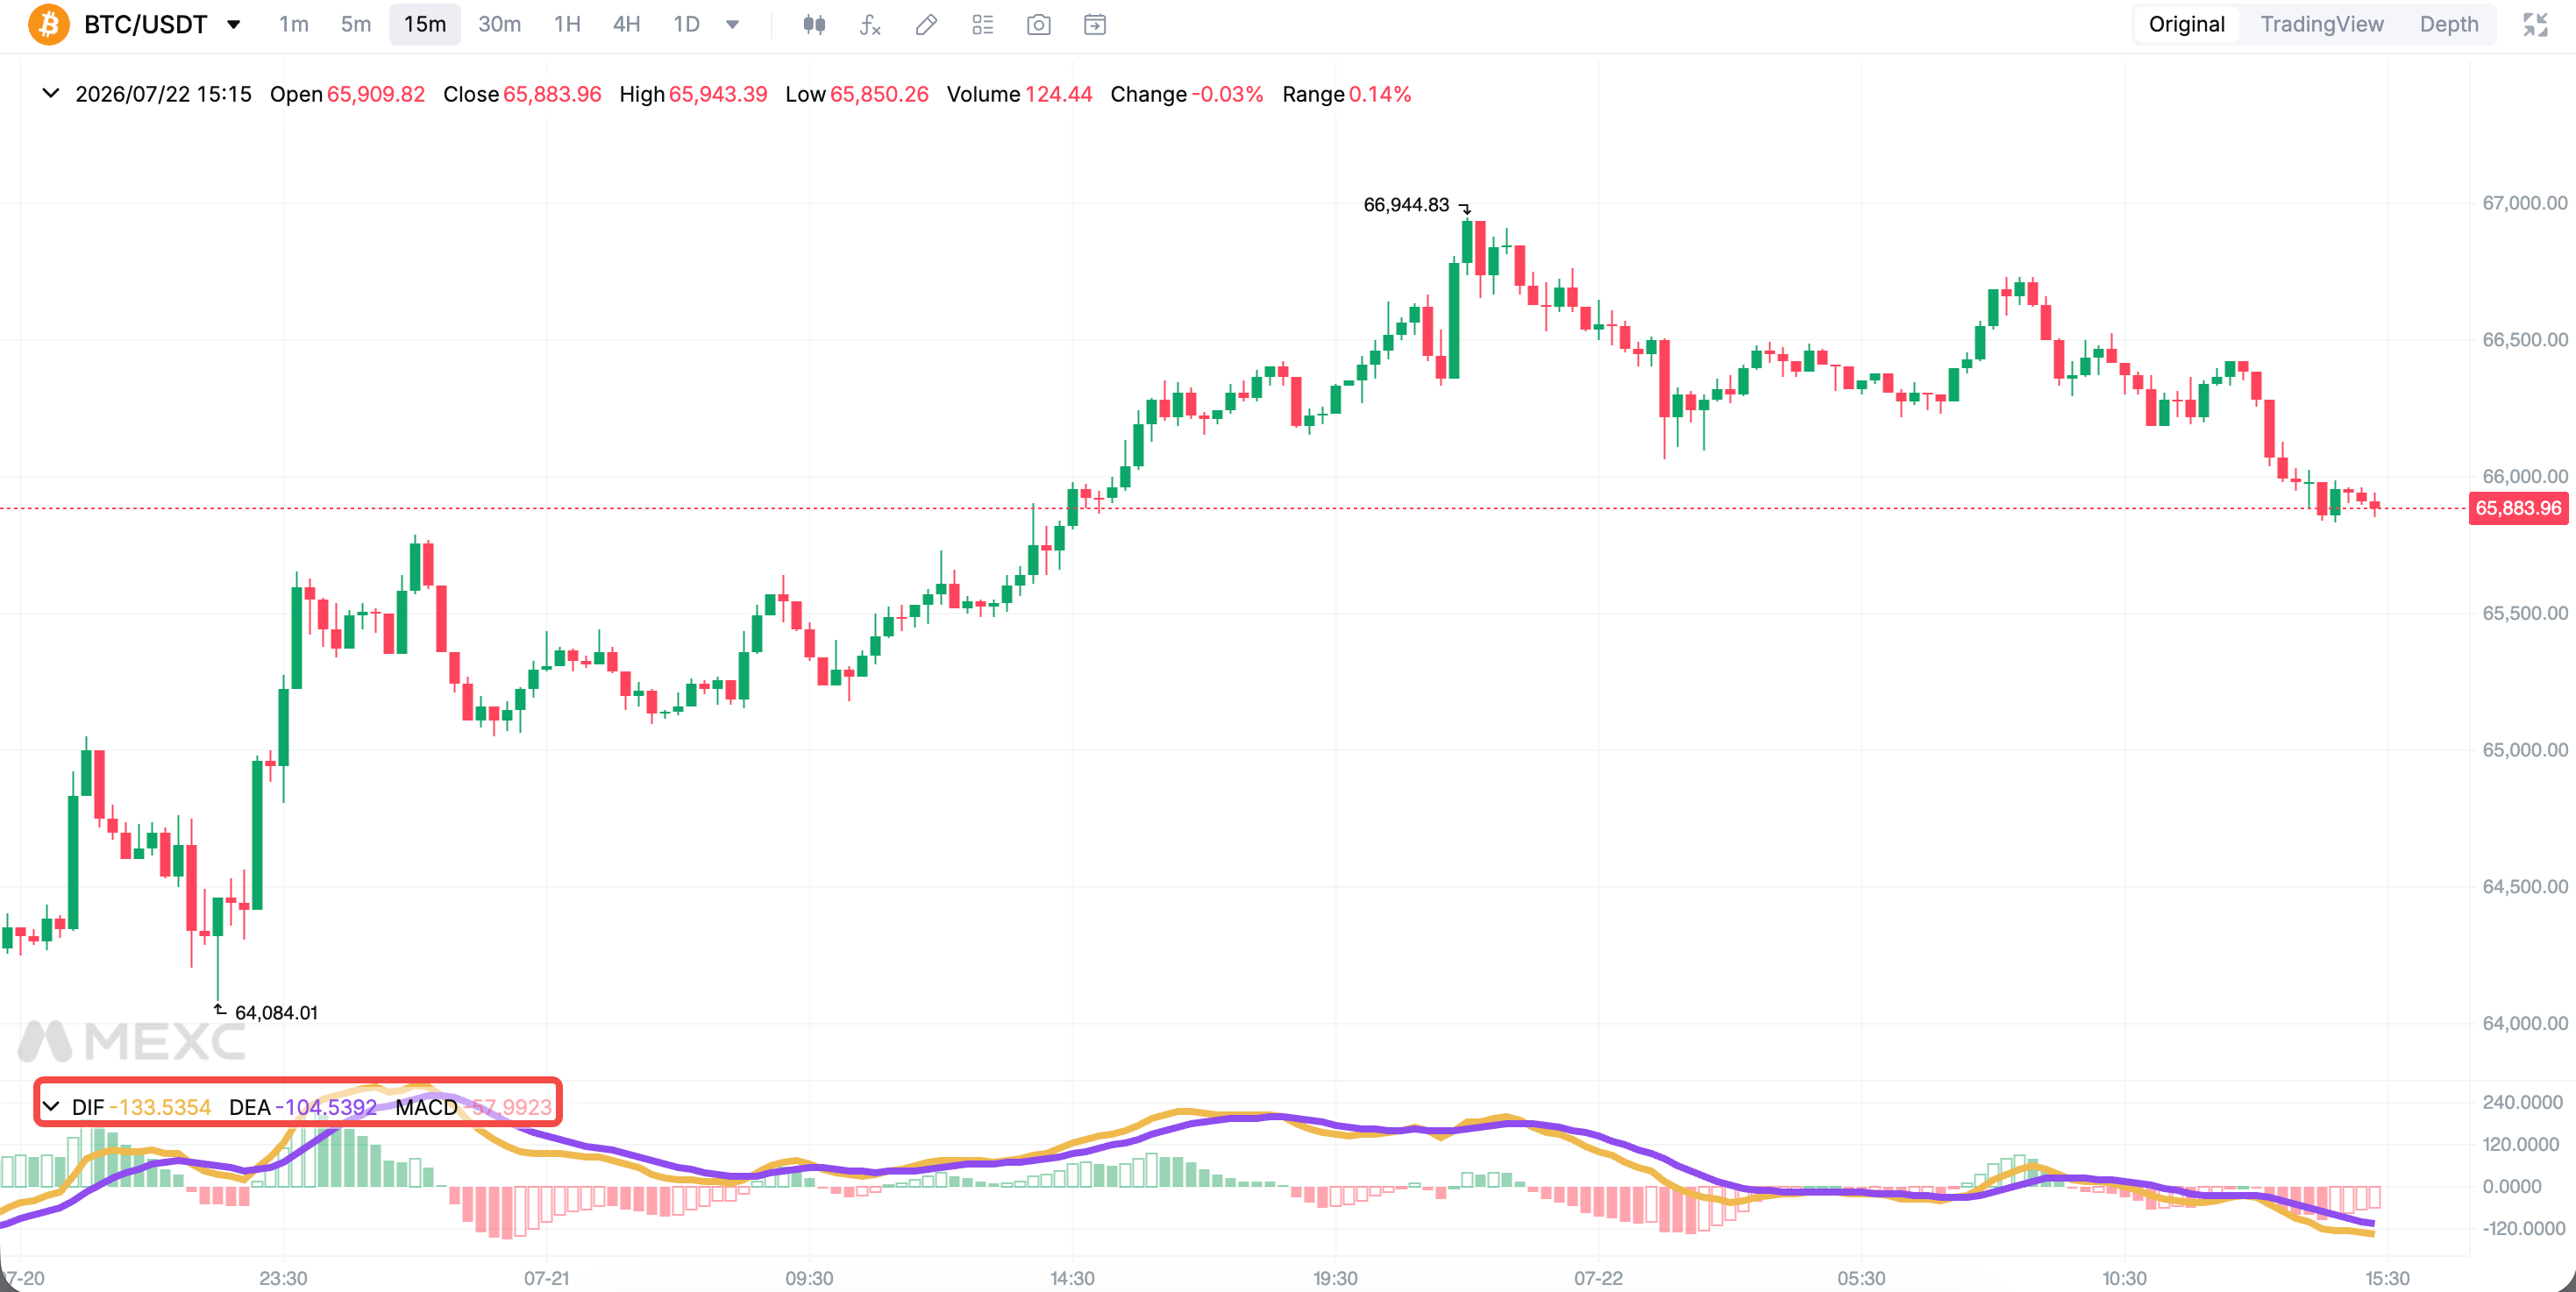
2. Components of the MACD Indicator
MACD usually appears in a separate panel below the price chart and consists of three components:
MACD line, or DIF: This line is calculated by subtracting the 26-period exponential moving average from the 12-period exponential moving average. It responds to changes in the relationship between short-term and longer-term price momentum.
Signal line, or DEA: This is typically a 9-period exponential moving average of the MACD line. It is smoother than the MACD line and is used to identify potential crossover signals.
MACD histogram: The histogram represents the distance between the MACD line and the signal line. Expanding bars generally indicate increasing momentum, while contracting bars may indicate that momentum is weakening. A change in the histogram alone does not confirm a trend reversal.
3. How to Interpret MACD: Three Core Uses
3.1 MACD line and signal line crossovers
- Potential bullish crossover: The MACD line crosses above the signal line. This may indicate that bullish momentum is increasing and can provide a potential entry signal when confirmed by price action.
- Potential bearish crossover: The MACD line crosses below the signal line. This may indicate that bearish momentum is increasing and can provide a potential exit or short-entry signal when confirmed by other factors.
Crossovers can generate frequent false signals in sideways markets. Traders may look for confirmation from price action, volume, or a break of a key support or resistance level before entering a position.
3.2 Zero-line crossovers
The zero line can help traders interpret the relationship between the shorter-term and longer-term exponential moving averages:
- MACD line above zero: The shorter-term exponential moving average is above the longer-term exponential moving average, which may indicate a bullish market bias.
- MACD line below zero: The shorter-term exponential moving average is below the longer-term exponential moving average, which may indicate a bearish market bias.
A move across the zero line can provide additional confirmation of a change in trend direction. However, it occurs after the underlying moving averages have already shifted and may therefore lag behind the price.
3.3 MACD divergence
- Bullish divergence: The price forms a lower low while MACD forms a higher low. This may indicate that bearish momentum is weakening and that an upward reversal could develop.
- Bearish divergence: The price forms a higher high while MACD forms a lower high. This may indicate that bullish momentum is weakening and that a downward reversal could develop.
Divergence can be useful near established support or resistance, but it may persist or fail without producing a reversal. Traders should wait for confirmation from price structure, volume, or another indicator before entering a position.
4. MACD Settings for Different Trading Styles
The standard MACD settings are 12, 26, and 9 periods. These settings are widely used, but they are not universally optimal. The appropriate parameters depend on the asset, chart timeframe, market conditions, and trading style.
- Intraday and short-term trading: Some traders use shorter combinations, such as 5, 13, and 6, or 5, 35, and 5. These settings respond more quickly to price changes but can also generate more noise and false signals.
- Swing trading: Traders may use the standard 12, 26, and 9 settings or test longer combinations, such as 21, 55, and 9. Longer settings generally produce smoother signals but react more slowly to market changes.
Beginners are advised to test different settings in a demo environment or with small amounts before applying them to live trading. Historical performance does not guarantee that the same parameters will work under future market conditions.
5. Tools to Use With MACD
MACD is calculated from historical price data and has limitations when used alone. The following tools can provide additional context:
Relative Strength Index(RSI): RSI helps assess overbought and oversold conditions. When RSI and MACD point in the same direction, the combined reading may provide stronger context, but it does not guarantee the outcome.
Support and resistance: A bullish crossover near established support or a bearish crossover near established resistance may be more meaningful than a crossover in the middle of an undefined range.
Multiple timeframe analysis: Traders may use a higher timeframe, such as the daily chart, to identify the broader trend and a lower timeframe, such as the hourly chart, to look for potential entries that align with that trend.
Volume: An MACD signal accompanied by increasing volume may indicate stronger market participation. Low volume can make a breakout or trend signal less convincing.
6. How to Set Up MACD on MEXC
Open the Spot or Futures trading page, select Indicators on the candlestick chart, and search for MACD. After adding the indicator, review the current market structure and consider the following risk management principles:
1)Set a stop-loss based on market structure. For example, after a confirmed bullish crossover, a stop-loss may be placed below a recent swing low.
2)Define a reasonable risk-reward plan before entering a position. A nearby support or resistance area may be used as one reference for a potential target.
3)Avoid repeatedly trading every crossover in a sideways market, where false signals are more common.
4)If the histogram continues to contract, review the position and consider tightening the stop-loss or reducing exposure. This does not mean a reversal is guaranteed.
7. MACD FAQ
7.1 How do I use MACD in trading?
Add MACD to a candlestick chart and monitor three types of readings. A crossover between the MACD line and signal line may indicate a change in momentum, a zero-line crossover may help confirm trend direction, and divergence between price and MACD may indicate a possible reversal. Confirm these readings with price action, support and resistance, or volume before trading.
7.2 How can I tell whether MACD is bullish or bearish?
MACD may have a bullish bias when the MACD line is above both the zero line and the signal line. It may have a bearish bias when the MACD line is below both the zero line and the signal line. An expanding histogram can indicate increasing momentum in the current direction, while a contracting histogram may indicate weakening momentum.
7.3 What are the potential buy and sell signals for MACD?
Potential bullish signals include the MACD line crossing above the signal line, the MACD line moving above zero, and bullish divergence. Potential bearish signals include the MACD line crossing below the signal line, the MACD line moving below zero, and bearish divergence. Multiple aligned signals may provide stronger context, but they do not guarantee a successful trade.
7.4 Is RSI or MACD better, and can they be used together?
Neither indicator is universally better because they serve different purposes. MACD focuses on trend direction and momentum changes, while RSI helps identify overbought and oversold conditions. They can be used together for confirmation, but traders should still consider price structure and risk management.
7.5 Can MACD be used for day trading?
It can be. Day traders may use shorter MACD settings on charts such as the 15-minute or one-hour timeframe to increase responsiveness. Shorter settings and lower timeframes also produce more false signals, so traders should confirm the broader trend and use strict risk controls.
Recommended Reading
Risk Warning: Technical indicators are based on historical data and do not guarantee future performance. Digital assets are highly volatile, and trading involves risk. Make decisions carefully based on your risk tolerance and avoid blindly following market trends.