

How to Use Williams %R (WR) in Trading: A Complete Beginner's Guide
Key Takeaways:
- The Williams %R indicator is a momentum indicator developed by Larry Williams to identify overbought and oversold market conditions.
- Williams %R fluctuates between 0 and -100. Readings above -20 indicate overbought conditions, while readings below -80 indicate oversold conditions.
- The standard calculation period for Williams %R is 14, but traders can adjust it according to their trading style.
- Williams %R can be combined with tools such as moving averages to improve signal reliability and filter out false signals.
- Users can easily add Williams %R to the chart on MEXC to support their cryptocurrency trading strategies.
1. What Is Williams %R?
Williams %R, also known as the Williams Percent Range or WR indicator, is a momentum-based technical indicator developed by legendary trader Larry Williams. It compares the current closing price with the highest and lowest prices over a selected period to measure overbought and oversold market conditions. Traders use it to assess trend strength, identify potential reversal points, and determine possible entry and exit opportunities.
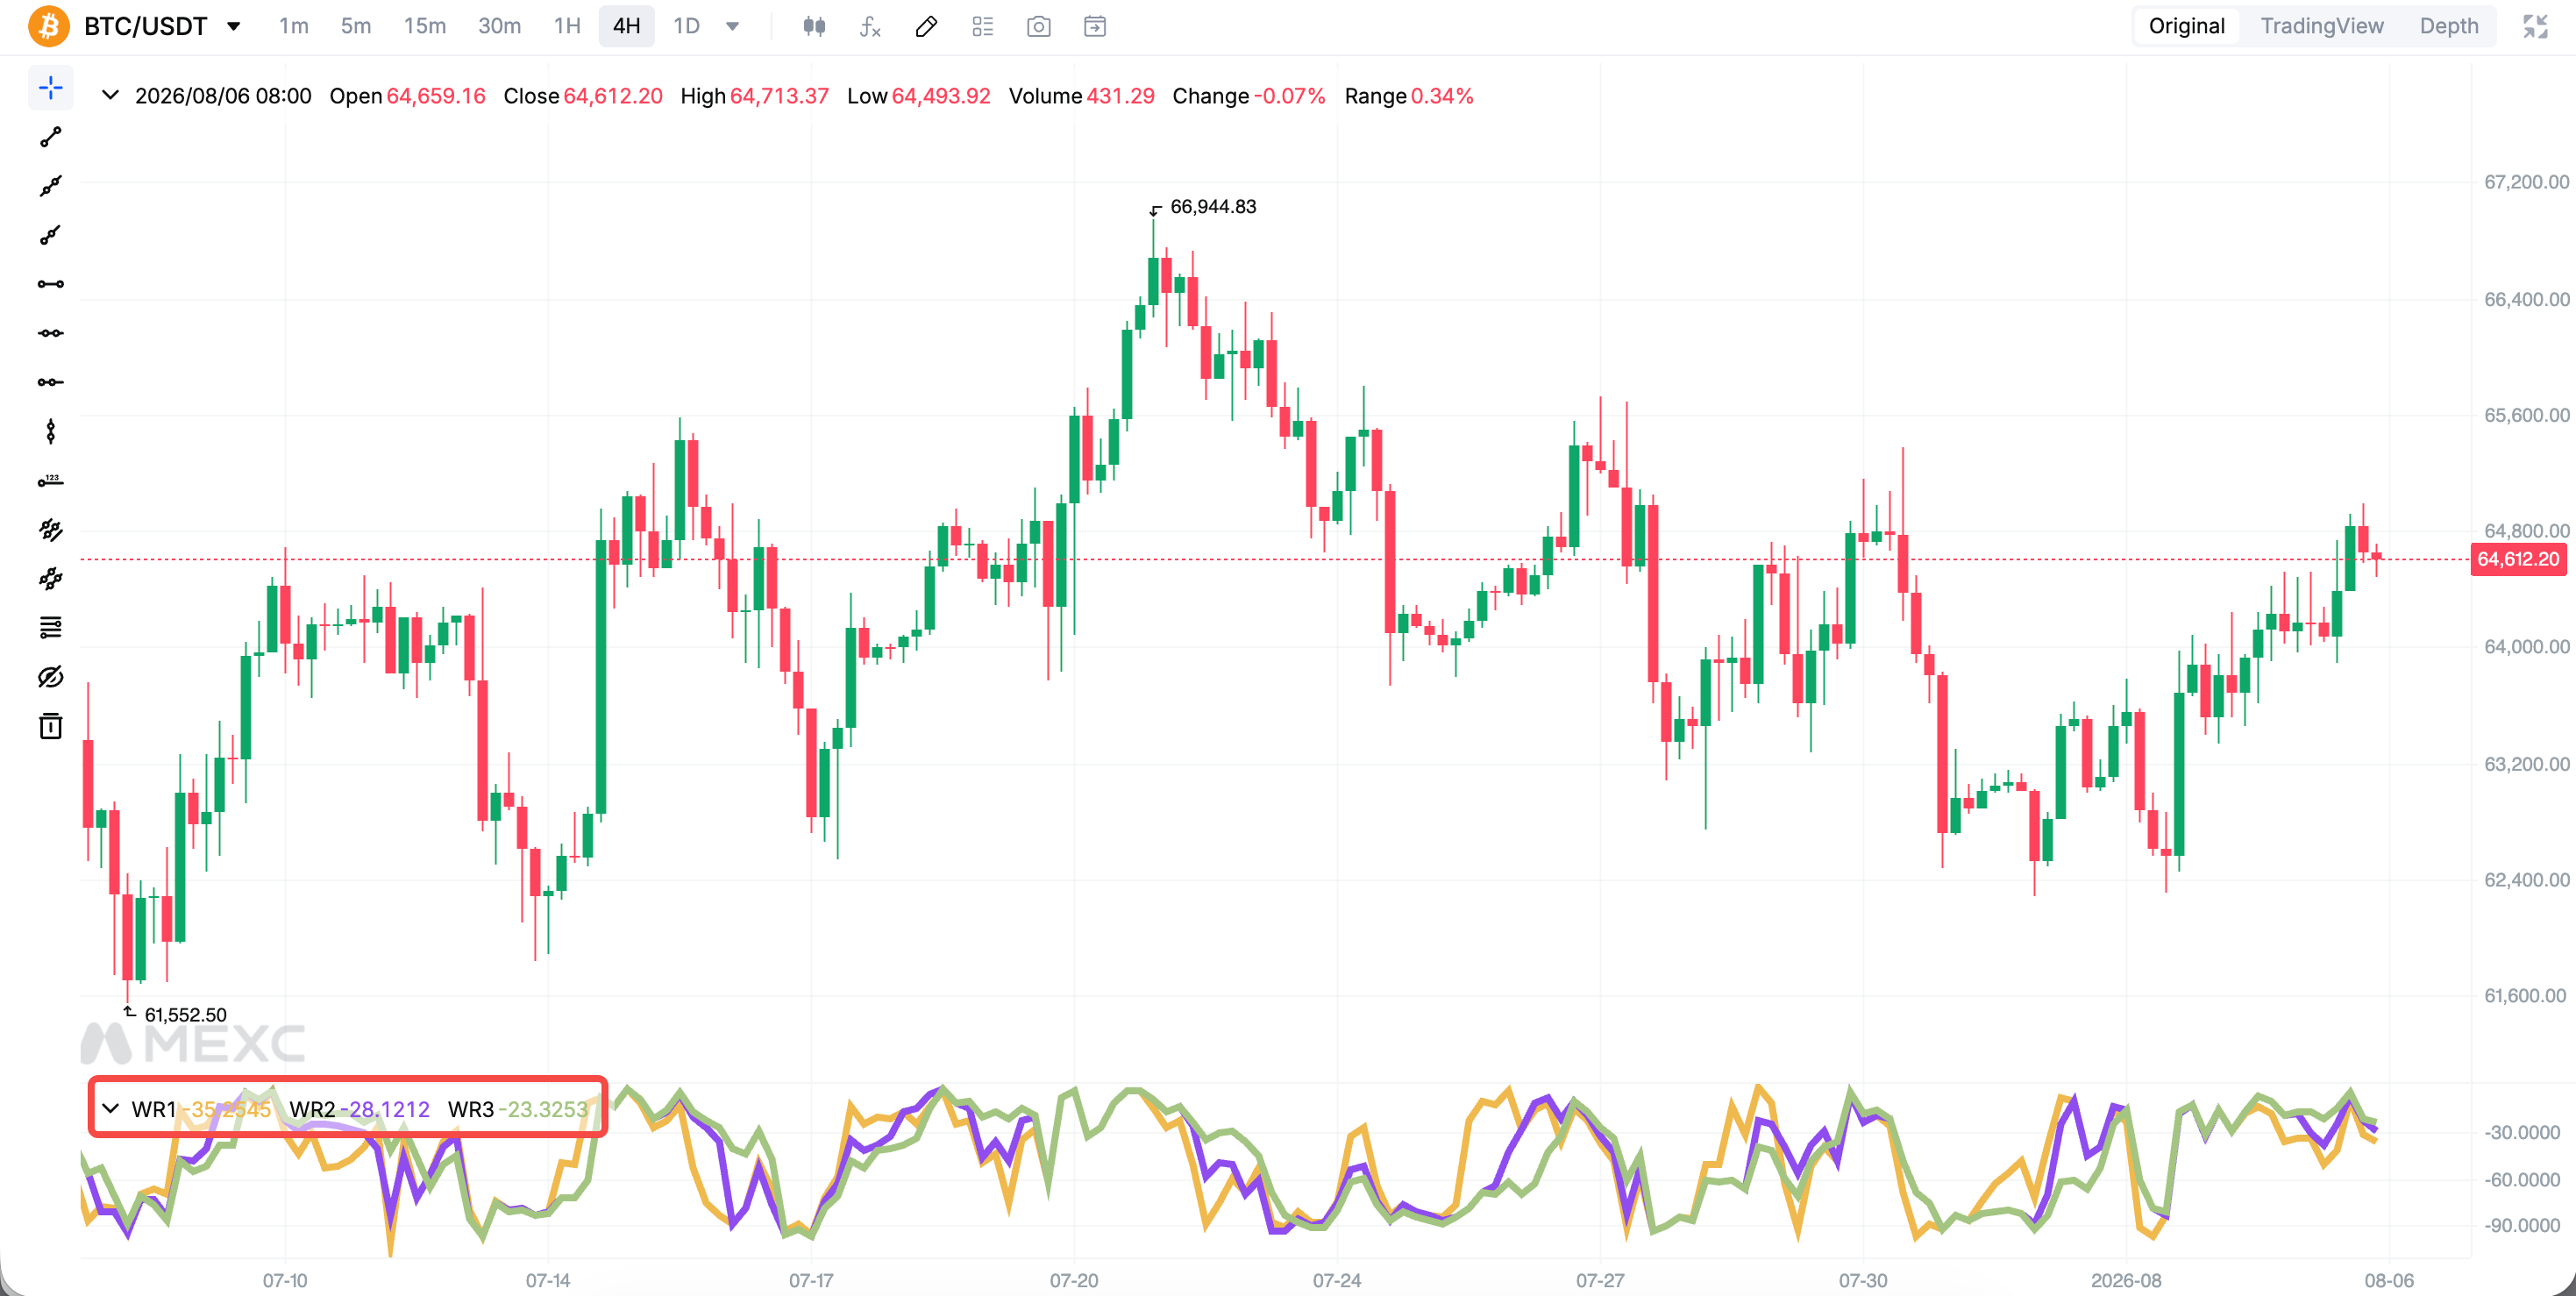
Williams %R ranges from 0 to -100:
- 0 to -20: The market is considered overbought. The price is close to its recent high and may face pullback pressure.
- -80 to -100: The market is considered oversold. The price is close to its recent low and may rebound.
- -50 midpoint: A move above -50 indicates strengthening bullish momentum, while a move below -50 indicates strengthening bearish momentum.
Cryptocurrency prices can be highly volatile, the responsiveness of Williams %R makes it a widely used supplementary tool among traders. Users can add the WR indicator directly to the candlestick chart on MEXC for market analysis.
2. How to Interpret Williams %R Signals
2.1 Overbought and Oversold Signals
Overbought signal: When WR rises above -20 and approaches 0, the price is close to the upper end of its recent range. The market may face pullback pressure, and traders may consider reducing their positions or looking for selling opportunities.
Oversold signal: When WR falls below -80 and approaches -100, the price is close to the lower end of its recent range. The market may rebound, and traders may watch for buying opportunities.
Overbought and oversold readings do not necessarily indicate an immediate trend reversal. During a strong uptrend, WR may remain in overbought territory for an extended period. Similarly, it may remain oversold during a strong downtrend. Traders should therefore interpret these signals in the context of the broader market trend.
2.2 Midpoint Signals
The -50 level is the midpoint of Williams %R. When the indicator crosses above -50, the price has entered the upper half of its recent range, suggesting bullish market conditions. When it crosses below -50, market conditions are considered bearish. Traders commonly use midpoint signals to confirm the direction of a trend.
2.3 Divergence Signals
Bearish divergence: The price reaches a new high, but WR fails to reach a corresponding new high. This suggests that upward momentum is weakening and that a pullback may occur, creating a potential sell signal.
Bullish divergence: The price reaches a new low while WR forms a higher reading. This indicates that downward momentum may be weakening and that a reversal could occur, creating a potential buy signal.
3. Williams %R Trading Strategies
3.1 Overbought and Oversold Reversal Strategy
When WR falls below -80 and subsequently crosses back above it, traders may interpret the move as a buy signal. When WR rises above -20 and then crosses back below it, traders may interpret the move as a sell signal. Waiting for the indicator to cross back through the key level before entering a position can help reduce the risk of entering too early.
3.2 Combining Williams %R With a 20-Day Moving Average
Using Williams %R alone may generate false signals. Combining it with a moving average can improve signal reliability:
- Long: The price is above the 20-day moving average, and WR is above the -50 midpoint.
- Short: The price is below the 20-day moving average, and WR is below the -50 midpoint.
While holding a position, traders may consider exiting if the price crosses the moving average in the opposite direction or if WR crosses the midpoint against the position.
3.3 Support and Resistance Confirmation Strategy
Reversal signals may be more reliable when extreme Williams %R readings appear near key support or resistance levels. For example, if the price tests a strong support level while WR approaches -100, the combination may indicate a higher probability of a rebound.
3.4 Multiple-Timeframe Confirmation
Analyzing Williams %R across multiple timeframes can help filter out market noise. For example, when both the daily and weekly WR indicators show oversold readings, the basis for a potential buy setup may be stronger. If the signals across the two timeframes conflict, traders may consider remaining cautious and waiting for further confirmation.
4. How to Use the Williams %R Indicator on MEXC
Follow these steps to use Williams %R on MEXC:
1)Sign up and log in to your MEXC account.
3)Click the indicators button above the chart and search for WR.
4)Add the indicator and adjust the period according to your trading style. The default period is 14.
5)Combine WR signals with other analytical tools to develop a trading plan and apply appropriate risk management.
5. Advantages and Limitations of Williams %R
Advantages: Williams %R is a bounded oscillator with intuitive readings that are easy to interpret, making it particularly useful for beginners seeking to identify overbought and oversold market conditions. It is also highly responsive and may detect changes in momentum relatively early.
Limitations: Because Williams %R only analyzes the price range within a selected lookback period, it may generate frequent false signals in range-bound markets. Signals may also fluctuate repeatedly during periods of extreme volatility. Traders should therefore avoid using Williams %R as a standalone trading signal. It is generally more effective when combined with moving averages, candlestick patterns, trendlines, trading volume, and relevant market fundamentals.
6. Williams %R FAQ
6.1 What is WR?
WR is a momentum indicator developed by Larry Williams. It compares the closing price with the recent high-low range to measure overbought and oversold market conditions. Its values range from 0 to -100.
6.2 How do you interpret WR?
A reading above -20 indicates overbought conditions and shows that the price is close to its recent high. A reading below -80 indicates oversold conditions and shows that the price is close to its recent low. The -50 midpoint can be used to assess the relative strength of bullish and bearish momentum.
6.3 What is the best parameter setting for WR?
The standard setting is 14 periods and is suitable for most market conditions. Short-term traders may use a shorter period, such as 7 or 9, to increase sensitivity. Longer-term traders may use a longer period, such as 21 or 28, to filter out market noise.
6.4 How accurate is WR?
WR signals may be more reliable in markets with clearly defined trends, but the indicator can generate false signals in range-bound conditions. Traders should combine it with other technical indicators and use stop-loss strategies to manage risk.
6.5 What is the difference between WR and the Relative Strength Index?
Both are momentum indicators. WR measures the position of the closing price relative to the highest price within a selected range and tends to be more responsive. The Relative Strength Index measures the relative magnitude of price gains and losses and generally produces smoother signals. WR may be more suitable for identifying short-term reversals, while RSI is often used to confirm broader trend strength.
6.6 What is the difference between WR and the Stochastic Oscillator?
WR uses the highest price within the selected range as its reference point and moves between 0 and -100. The Stochastic Oscillator uses the lowest price within the range as its reference point and moves between 0 and 100. The two indicators are fundamentally similar and produce almost identical patterns, but their scales move in opposite directions.
6.7 How can I use WR for scalping?
Scalpers may shorten the period to around 7 and look for signals where the indicator exits an extreme zone on a lower-timeframe chart. These signals should be confirmed using support and resistance levels, with strict stop-loss rules applied to every trade.
Recommended Reading:
Risk Disclaimer: Technical indicators are calculated using historical data and are provided for reference only. They cannot guarantee future market performance. Digital asset markets are highly volatile, and trading involves risk. Make decisions carefully based on your own risk tolerance and avoid following market trends blindly.