

Did Bitcoin Just Turn Bullish With a 5% Rebound? 2 Resistance Levels Say Not Yet
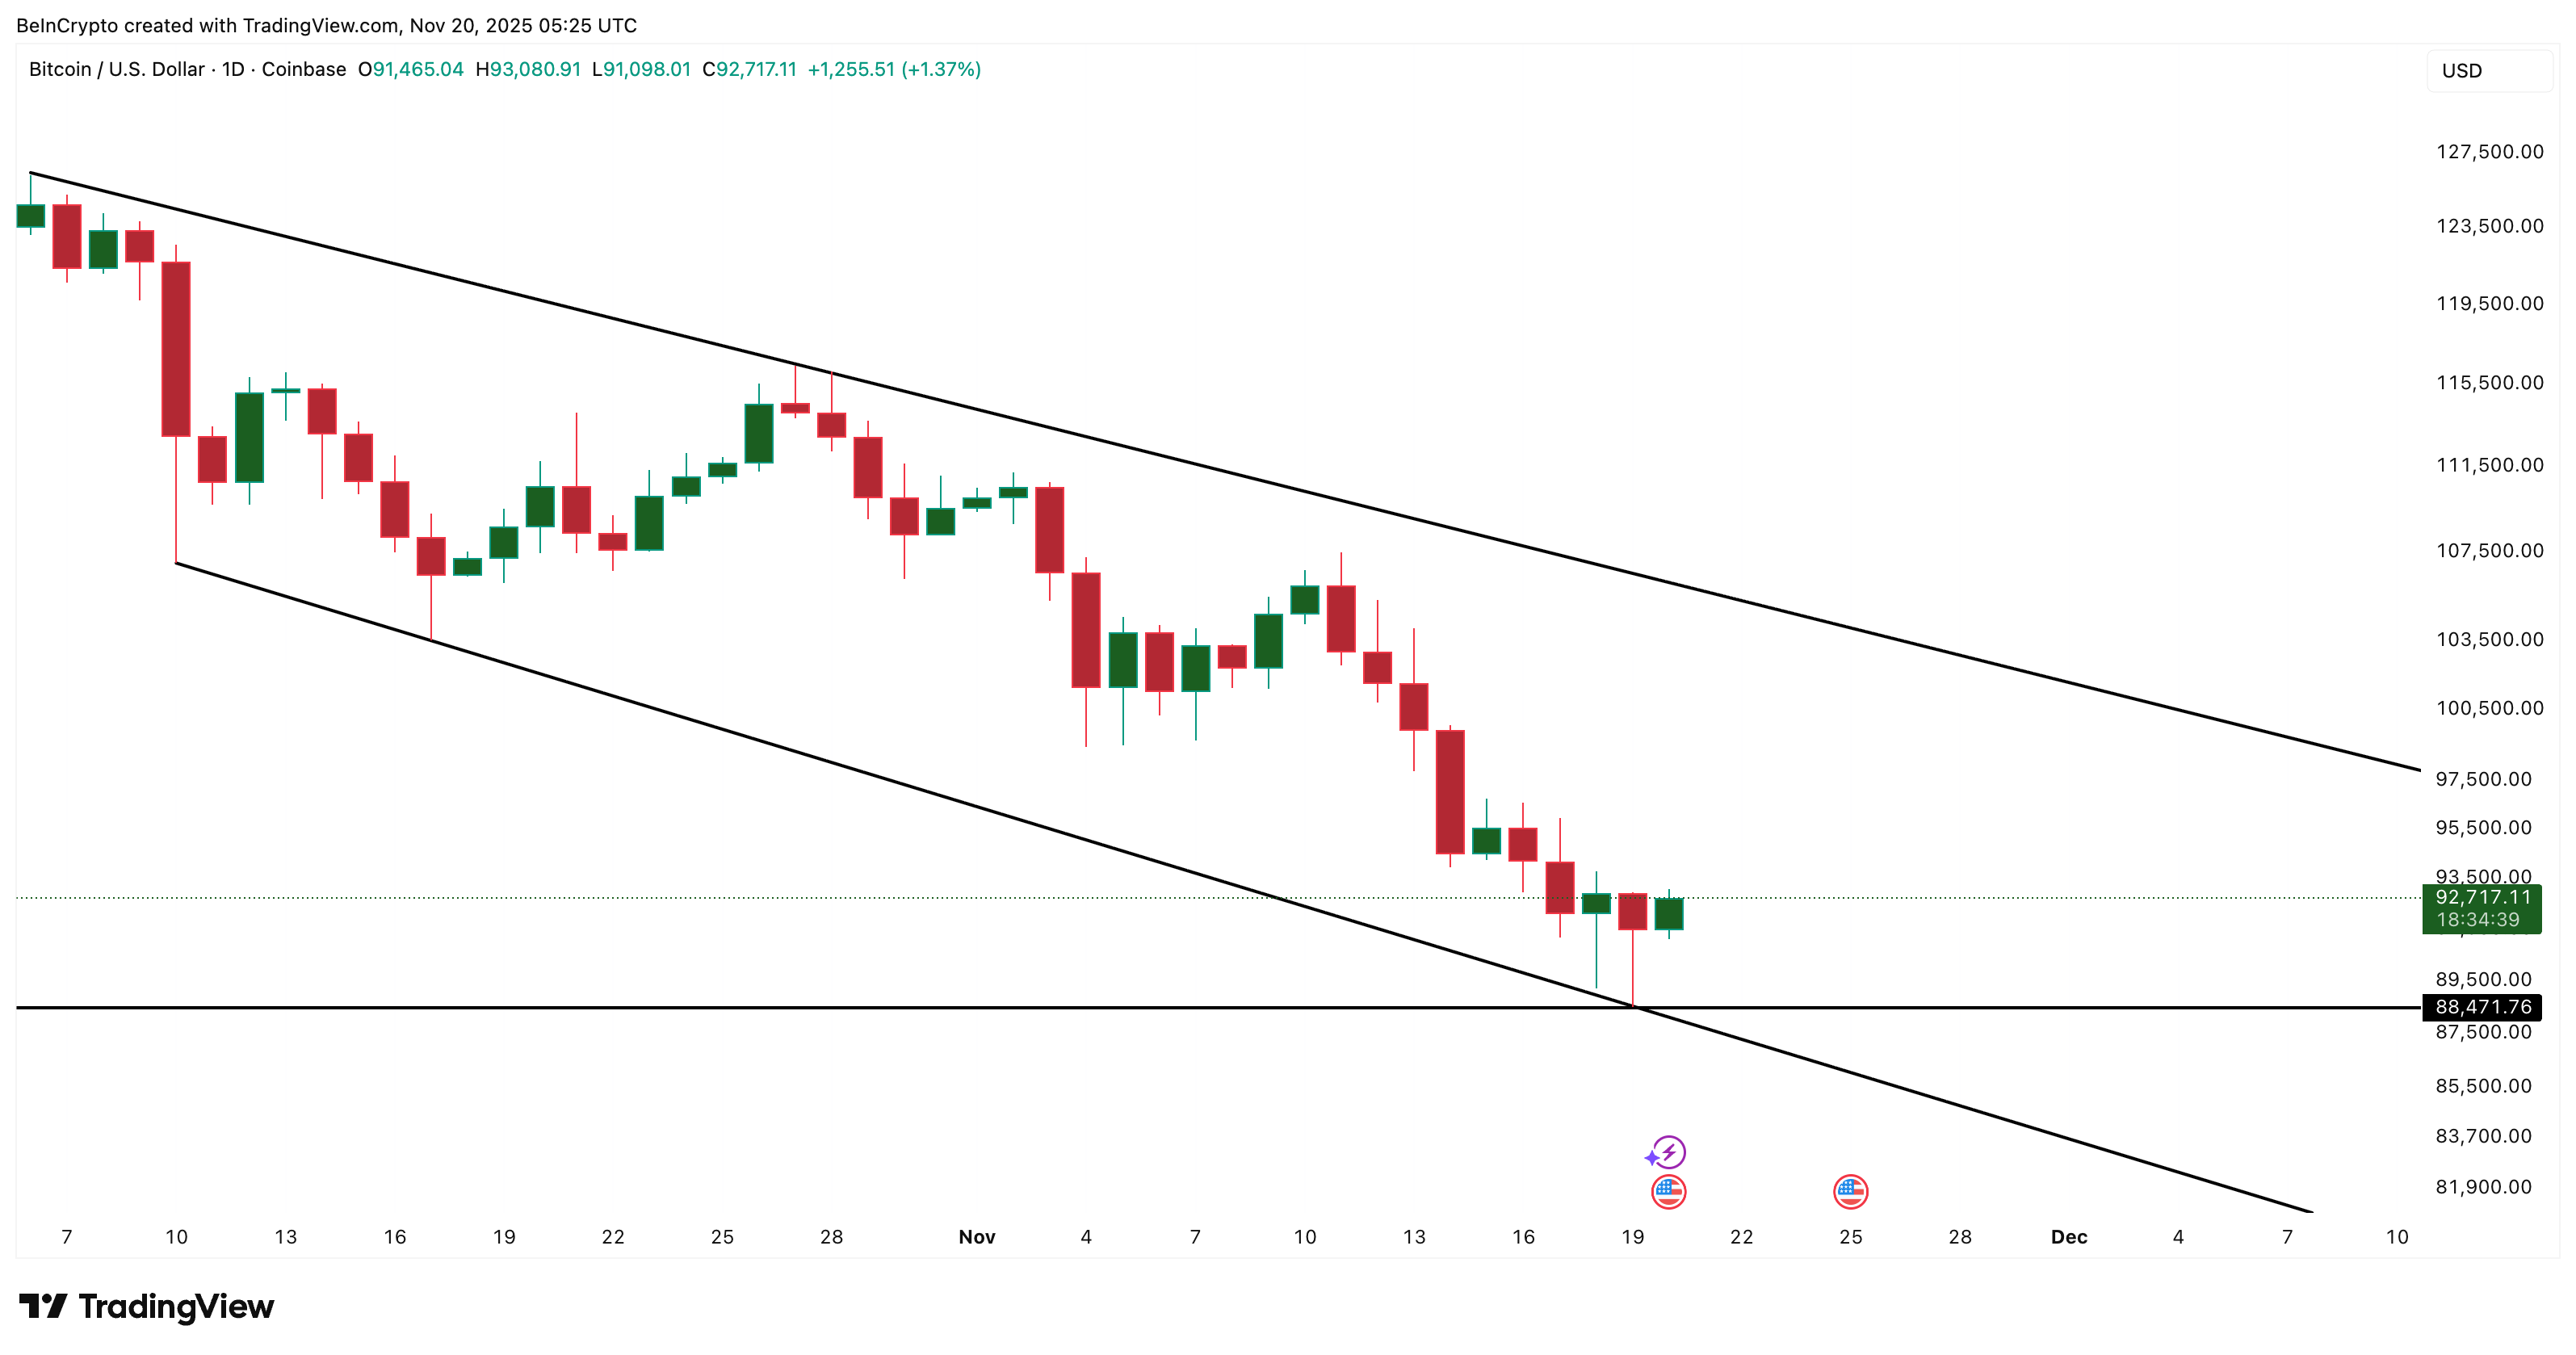
Bitcoin has bounced nearly 5% from today’s low of near $88,400, right at the edge of falling-wedge support. While the rebound was strong, the daily price chart shows a meager 2% uptick. It certainly doesn’t do justice to the strength the Bitcoin price showed over the past few hours.
The move happened quickly and followed the price, briefly tapping the lower trend line, raising the question of whether this could mark the start of a short-term bottom. But as strong as the rebound looks, one or rather two major resistance zones still decide whether the trend has flipped.
A Falling Wedge Rebound, and a Rare On-Chain Divergence Appears
The falling wedge has been guiding Bitcoin’s drop for weeks, and today’s reaction shows the lower boundary is still active. What makes the bounce more interesting is the on-chain behavior behind it.
 Bitcoin’s Falling Wedge: TradingView
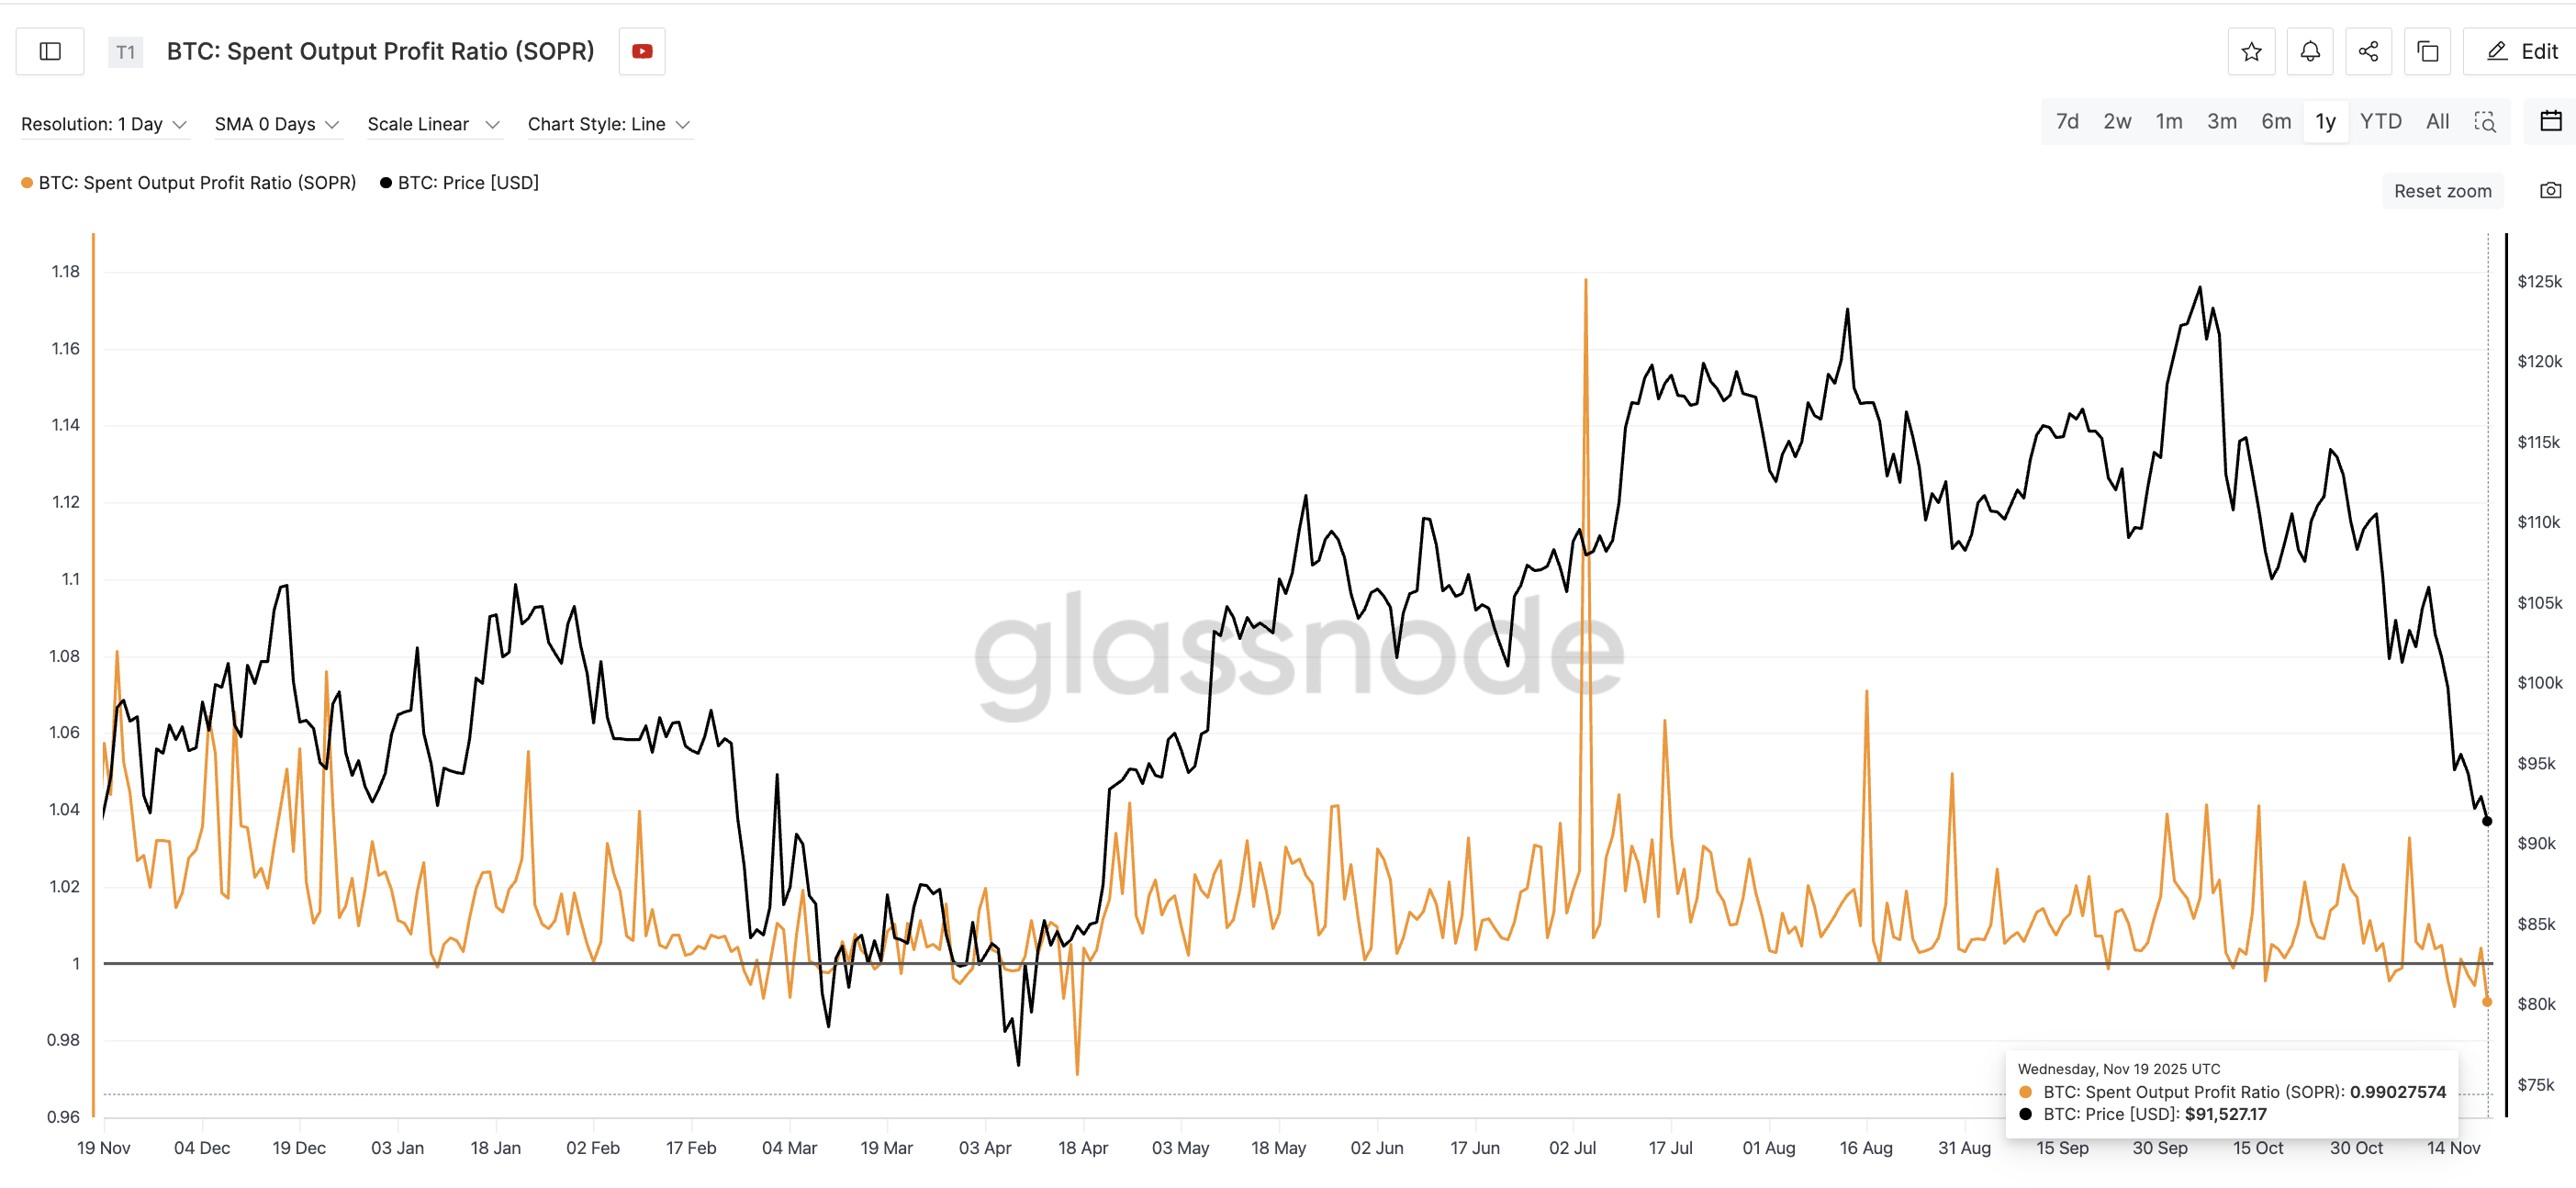
Between November 14 and November 19, the Bitcoin price made a lower low, but the SOPR (Spent Output Profit Ratio) made a higher low, rising from 0.98 to 0.99. SOPR shows whether the coins being spent were bought at a profit or a loss. When SOPR drops below 1, most traders are selling at a loss.
Want more token insights like this? Sign up for Editor Harsh Notariya’s Daily Crypto Newsletter here.
 SOPR Divergence Flashes: Glassnode
When it climbs while the price continues to fall, it means holders are not panic-selling and are refusing to exit at cheaper prices. That reflects a strong conviction.
A similar pattern showed up between March 30 and April 8. The BTC price made a lower low then too, while SOPR rose from 0.994 to 0.998, even though the market was still in a downtrend. That divergence marked the bottom. From there, Bitcoin rallied from $76,270 to $111,695 — a 46% surge, within weeks.
The same style of on-chain divergence is now flashing again inside the falling wedge. Do note that technical divergences can fail in heavy downtrends. On-chain divergences matter more because they reflect real spending behavior rather than just chart patterns.
Heavy Supply Zones Still Block the Trend Reversal
However, for the SOPR divergence to play out, the Bitcoin price needs to cross key levels.
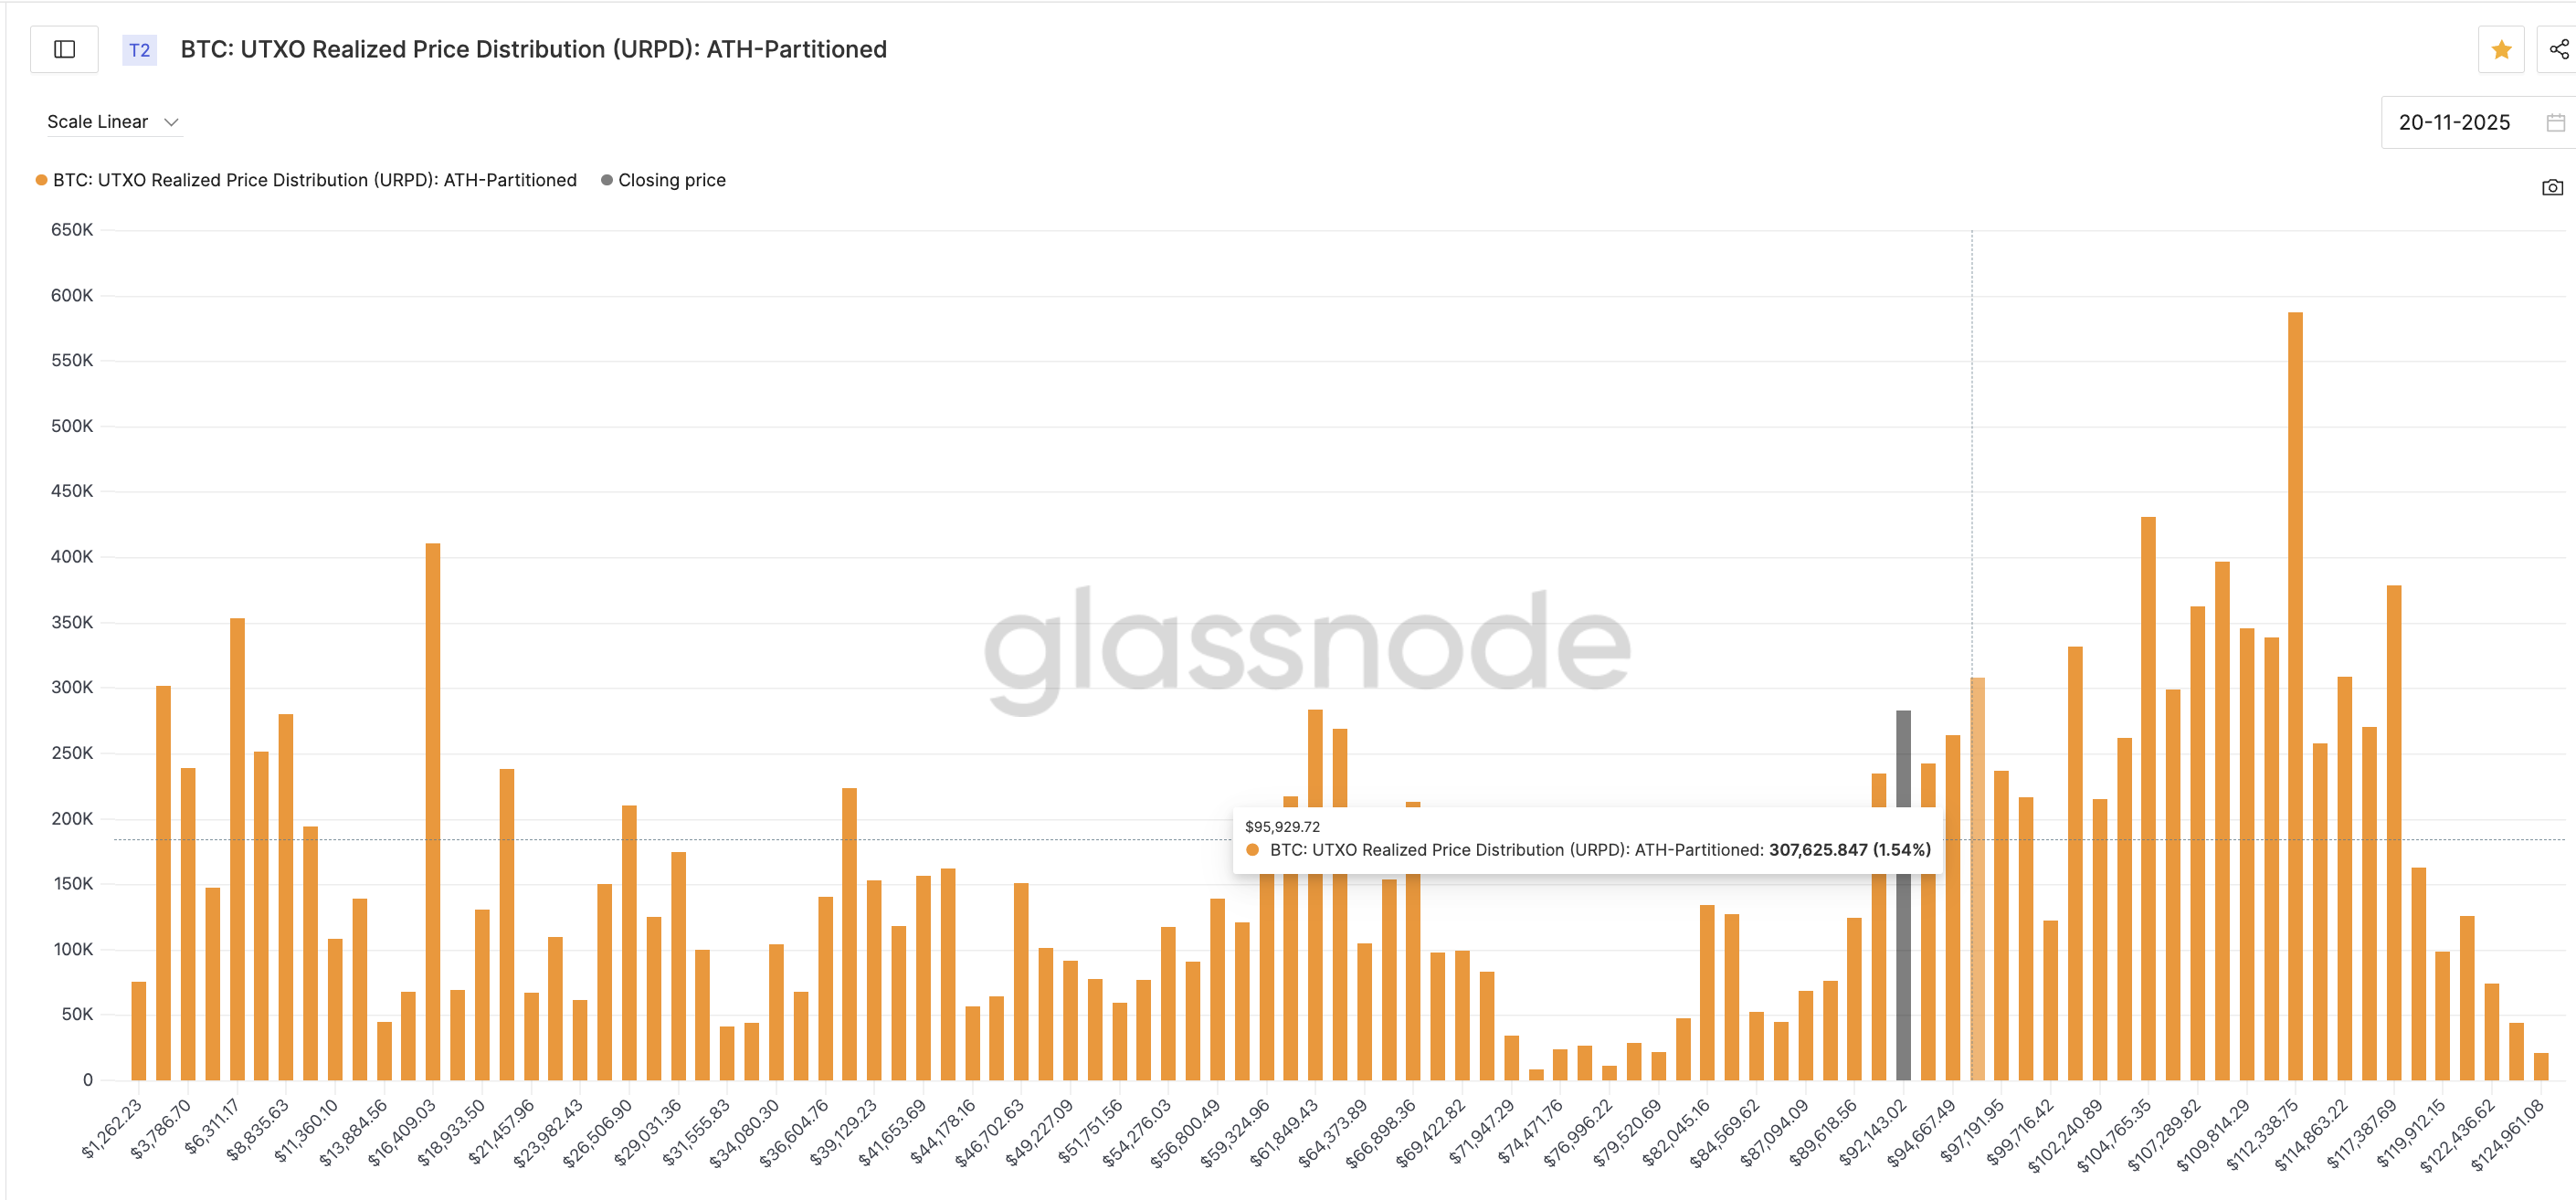
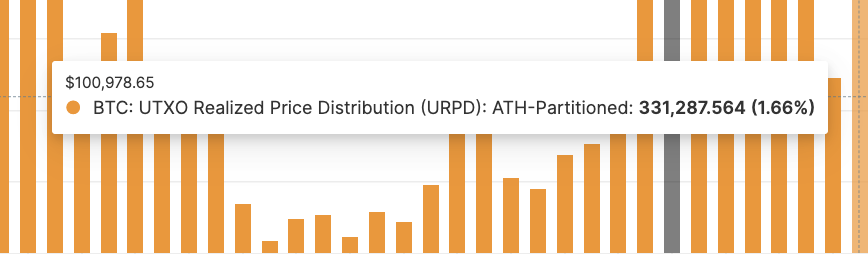
Glassnode’s URPD (UTXO Realized Price Distribution) data shows two supply clusters that sit right above the current rebound. The first is around $95,900, and the next sits close to $100,900.
 First BTC Resistance Or Supply Cluster: Glassnode
These levels also align with the key technical resistance zones that we will discuss next.
UTXO Realized Price Distribution (URPD) shows how much supply was last moved at each price level. It highlights where large clusters of holders sit, which often act as support or resistance.
 Higher BTC Supply Cluster: Glassnode
These are regions where many past buyers may try to exit again. Clearing both levels is the confirmation that turns a bounce into a trend reversal.
Bitcoin Price Levels That Matter
The Bitcoin price first needs to move past $95,700, the same level that rejected the recovery on November 15. This resistance level also aligns with the first URPD cluster, mentioned earlier.
If it clears that, it can attack $100,200, which is both a Fibonacci barrier and sits below the URPD cluster at $100,900. Only above this zone can the falling wedge truly flip bullish.
If BTC price loses the recent low near the wedge floor at $88,400, the price risks sliding lower if sentiment weakens.
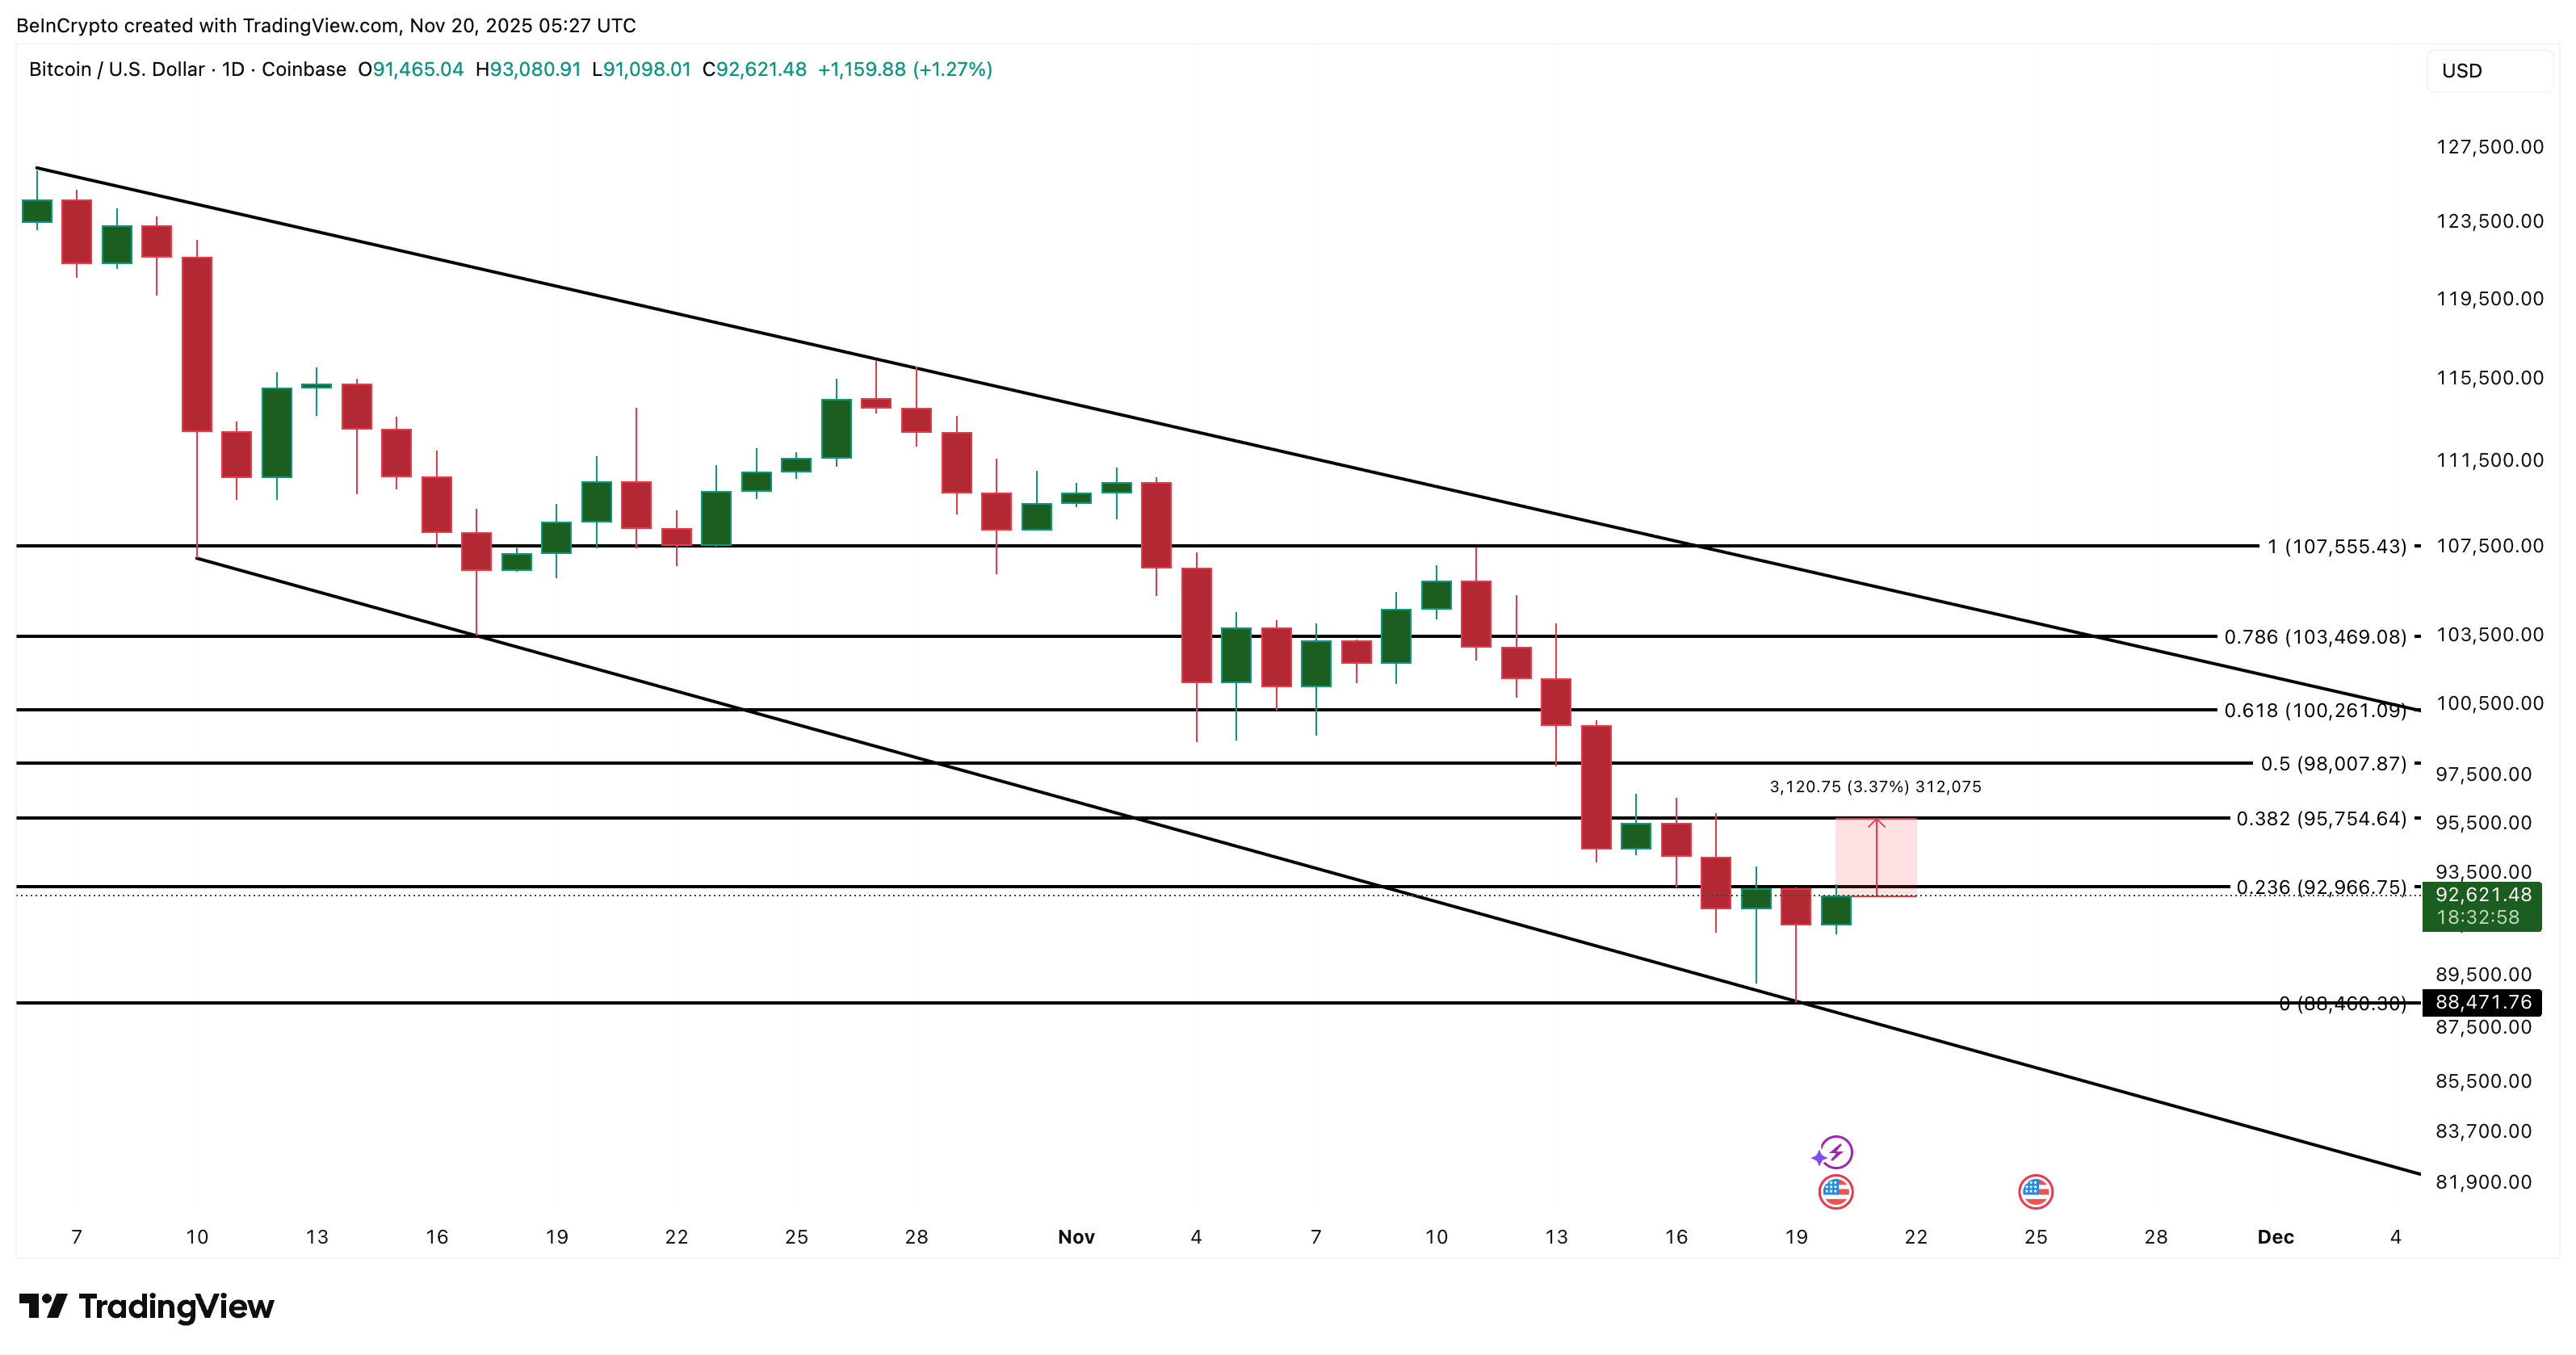 Bitcoin Price Analysis: TradingView
For now, Bitcoin has delivered a clean wedge bounce and a rare on-chain divergence. Those two together raise the odds of a bottom forming. But the resistances at $95,700 and then at $100,200 still decide whether Bitcoin just turned bullish — or if this is only a temporary bounce.


You May Also Like
Zcash is Predicted to Reach $ 562.89 By Jun 04, 2026

Bitcoin Whales Are Quietly Accumulating: A Strategic Move That Could Signal Major Market Shift

How Working Professionals in Singapore Are Trading SGX Stocks From Their Phone


