Kaspa price is showing signs of a full bullish reversal from its long downtrend after it broke out of a key descending trendline that has kept its price in check for months. Kaspa (KAS) has rallied over 40% in the…Kaspa price is showing signs of a full bullish reversal from its long downtrend after it broke out of a key descending trendline that has kept its price in check for months. Kaspa (KAS) has rallied over 40% in the…

Kaspa price targets 55% upside after breaking out of descending trendline

2025/11/27 18:22
3 min read
For feedback or concerns regarding this content, please contact us at crypto.news@mexc.com

Kaspa price is showing signs of a full bullish reversal from its long downtrend after it broke out of a key descending trendline that has kept its price in check for months.

Summary
  • Kaspa price has climbed 40% in the past week.
  • Whales have bought the recent dip in KAS token.
  • Multiple bullish reversal patterns have been confirmed on the daily chart.

Kaspa (KAS) has rallied over 40% in the past seven days to an intraday high of $0.061 on Thursday, Nov. 27, its highest level since mid‑October. Trading at $0.059 at press time, the PoW cryptocurrency still sits 48% below its July peak, where its previous downtrend began before this week’s rebound.

Kaspa price rebounded after it saw renewed demand from whales after it touched a yearly low of $0.036 just days earlier, likely forming the bottom.

According to a recent X post by Kaspa Builders, eight Kaspa wallets bought the recent dip and have accumulated over 35 million KAS tokens.

Investors often see such buying from large players as a sign of confidence, which in turn could lead to a major trend reversal in the short term. Notably, such activity, especially at a time when the broader crypto market is gripped by extreme fear, also likely played its part in triggering the rebound.

The recent whale accumulation has likely drawn the attention of derivatives traders. Data from CoinGlass shows that Kaspa’s futures open interest jumped by 25% over the past day to $79.2 million. Additionally, the long-short ratio has moved above 1, which indicates that more traders are now leaning toward bullish bets. 

A strong derivatives market can reinforce positive sentiment among retail investors and help sustain Kaspa’s recent gains over the short term.

Kaspa price analysis

On the daily chart, Kaspa price has broken out of a descending parallel channel pattern, which forms when an asset’s price trends downward with lower highs and lower lows while remaining within two descending sloping trendlines.

Kaspa price has broken above a multi-month descending trendline resistance on the daily chart.

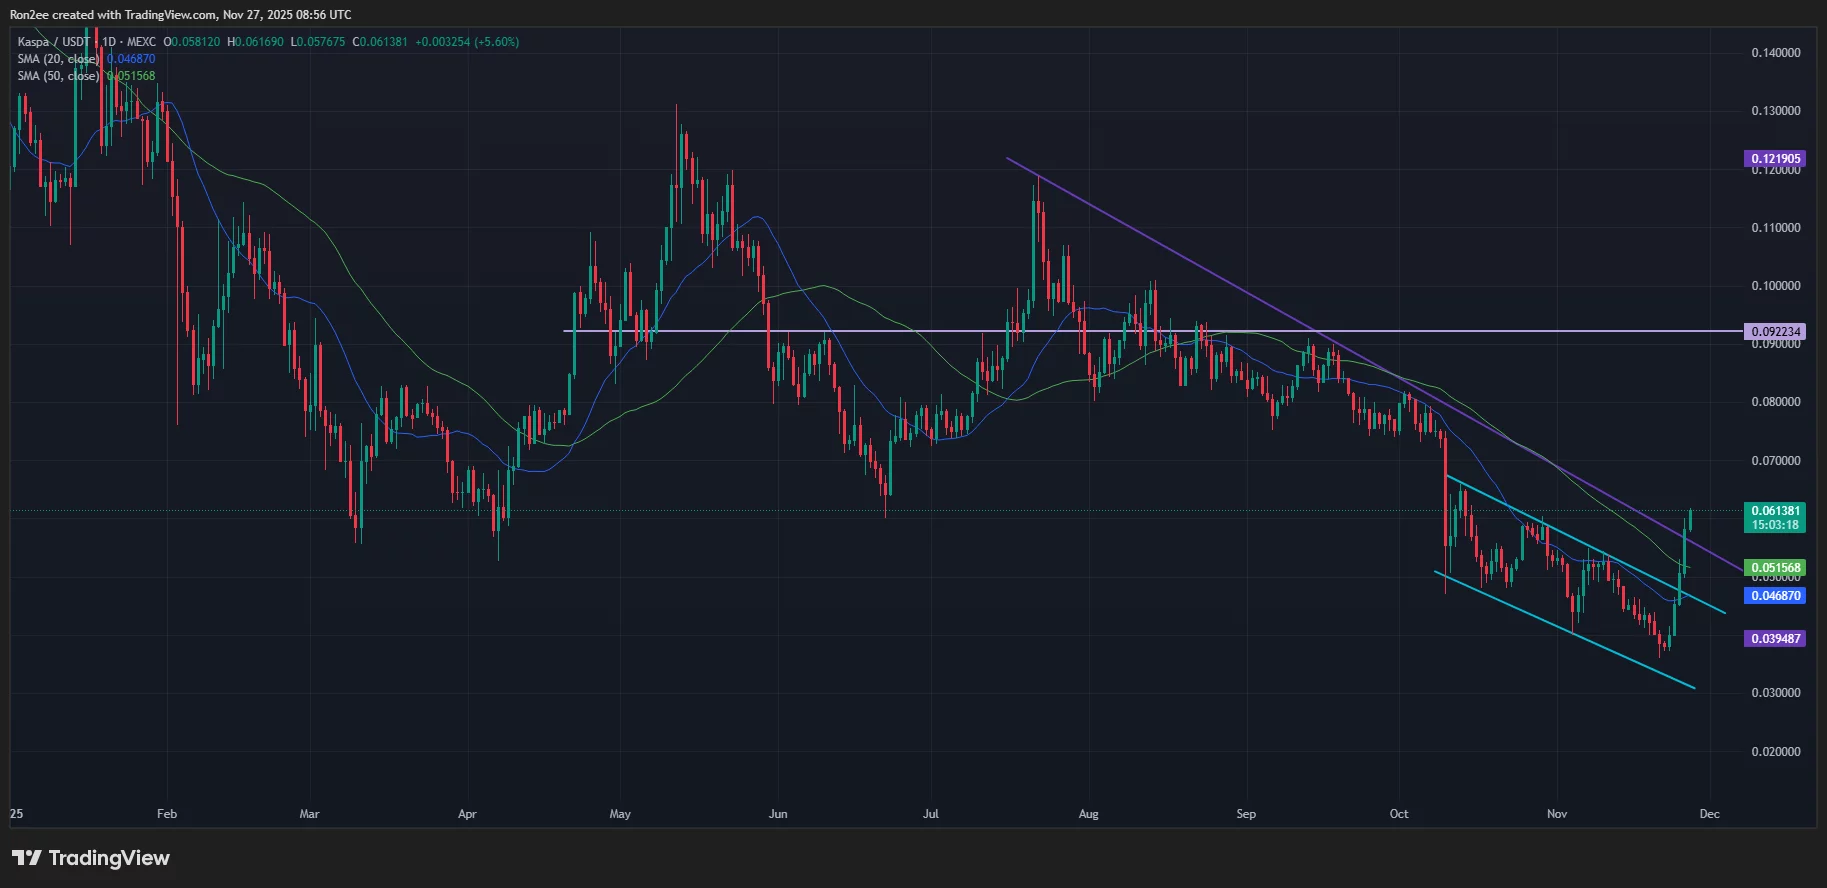
Typically, when an asset’s price breaks out of such a pattern, it signals a potential shift from a bearish trend to a bullish one.

Kaspa price remains above the 20-day and 50-day moving averages, which indicates that bulls have regained control of the short to mid-term momentum.

More importantly, the altcoin has broken out of a key descending trendline that had been serving as stiff resistance since late July. Traders have likely taken the breakout as further confirmation that the bearish phase may have ended and a new upward trend could be underway.

As such, Kaspa could most likely rally to $0.092, with no major resistance levels appearing on the chart between its current price and that target. It lies roughly 55% above the current price.

On the downside, $0.051, the 50-day moving average, remains the key support level to watch in case of any short-term pullbacks.

Disclosure: This article does not represent investment advice. The content and materials featured on this page are for educational purposes only.

Market Opportunity
Bullish Degen Logo
Bullish Degen Price(BULLISH)
$0.002204
$0.002204$0.002204
-2.34%
USD
Bullish Degen (BULLISH) Live Price Chart
Disclaimer: The articles reposted on this site are sourced from public platforms and are provided for informational purposes only. They do not necessarily reflect the views of MEXC. All rights remain with the original authors. If you believe any content infringes on third-party rights, please contact crypto.news@mexc.com for removal. MEXC makes no guarantees regarding the accuracy, completeness, or timeliness of the content and is not responsible for any actions taken based on the information provided. The content does not constitute financial, legal, or other professional advice, nor should it be considered a recommendation or endorsement by MEXC.

You May Also Like

Is Putnam Global Technology A (PGTAX) a strong mutual fund pick right now?

Is Putnam Global Technology A (PGTAX) a strong mutual fund pick right now?

The post Is Putnam Global Technology A (PGTAX) a strong mutual fund pick right now? appeared on BitcoinEthereumNews.com. On the lookout for a Sector – Tech fund? Starting with Putnam Global Technology A (PGTAX – Free Report) should not be a possibility at this time. PGTAX possesses a Zacks Mutual Fund Rank of 4 (Sell), which is based on various forecasting factors like size, cost, and past performance. Objective We note that PGTAX is a Sector – Tech option, and this area is loaded with many options. Found in a wide number of industries such as semiconductors, software, internet, and networking, tech companies are everywhere. Thus, Sector – Tech mutual funds that invest in technology let investors own a stake in a notoriously volatile sector, but with a much more diversified approach. History of fund/manager Putnam Funds is based in Canton, MA, and is the manager of PGTAX. The Putnam Global Technology A made its debut in January of 2009 and PGTAX has managed to accumulate roughly $650.01 million in assets, as of the most recently available information. The fund is currently managed by Di Yao who has been in charge of the fund since December of 2012. Performance Obviously, what investors are looking for in these funds is strong performance relative to their peers. PGTAX has a 5-year annualized total return of 14.46%, and is in the middle third among its category peers. But if you are looking for a shorter time frame, it is also worth looking at its 3-year annualized total return of 27.02%, which places it in the middle third during this time-frame. It is important to note that the product’s returns may not reflect all its expenses. Any fees not reflected would lower the returns. Total returns do not reflect the fund’s [%] sale charge. If sales charges were included, total returns would have been lower. When looking at a fund’s performance, it…
Share
BitcoinEthereumNews2025/09/18 04:05
Pro Global Scales Latin American Hub as Hybrid Model Accelerates Latin America Growth

Pro Global Scales Latin American Hub as Hybrid Model Accelerates Latin America Growth

Pro Global is accelerating its expansion in Latin America, with investment in its regional head office in Argentina as both international and domestic carriers
Share
ffnews2026/03/23 08:00
Tokenized deposits push Europe toward next-gen digital money

Tokenized deposits push Europe toward next-gen digital money

The post Tokenized deposits push Europe toward next-gen digital money appeared on BitcoinEthereumNews.com. As banks rewire payments and settlement systems, tokenized
Share
BitcoinEthereumNews2026/03/23 18:29