

MYX Finance & Pump.fun Price Prediction: Key Technical Levels to Watch This Week
The post MYX Finance & Pump.fun Price Prediction: Key Technical Levels to Watch This Week appeared first on Coinpedia Fintech News
The latest Bitcoin price crash has triggered strong bearish action across the markets. With market volatility picking up across the altcoin space, MYX Finance (MYX) and Pump.fun (PUMP) prices are emerging as two of the more actively traded tokens on traders’ radar. Both assets are testing critical technical zones, and the next 24 hours may dictate whether they confirm a breakout or extend their corrective structure. Here’s a sharp, technical breakdown of where each token could head next.
MYX Finance (MYX): Consolidation Near Support, Momentum Still Fragile
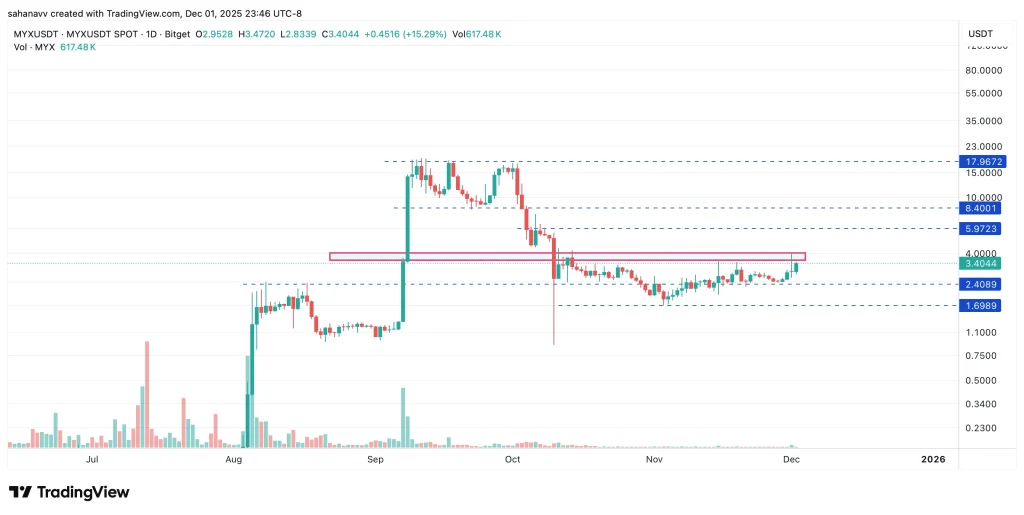
MYX Finance price is trading near $2.40, hovering close to a short-term support band between $2.20 and $2.30. This zone has acted as a stabilization floor multiple times, making it a key area to watch. A decisive bounce from here could shift short-term sentiment, but momentum indicators remain mixed, with low volume suggesting cautious participation.
Technical Levels to Watch
- Immediate Support: $2.40 – $2.25
- Secondary Support: $1.6
- Near-Term Resistance: $3.5–$4
- Breakout Trigger: $5.98
- Bullish Target: $8 to $10
- Bearish Target: $2.00 if support fails
A clean breakout above $3.5 with rising volume, would invalidate the current consolidation and open a path toward $6, potentially extending to $8.5. However, losing the $2.4 floor may drag MYX into a deeper correction towards $2.00, especially if broader market sentiment weakens.
24-Hour MYX Outlook:
Base case: $3.25–$3.60 range
Upside: $4.00
Downside: $2.00
- Also Read :
- Crypto Market Today Wiped Out $250B, What’s Next for Bitcoin & Altcoins?
- ,
Pump.fun (PUMP): Volatile Setup With a Clear Breakout Structure
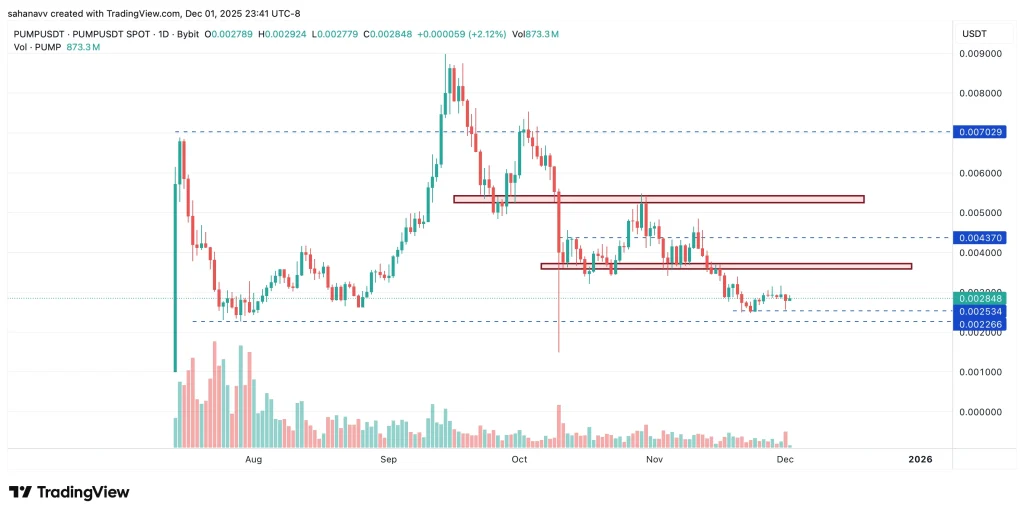
Pump.fun continues to show greater volatility than MYX, driven by strong community activity and periodic buyback announcements. PUMP price is currently trading between $0.0038 and $0.0050, sitting just below a descending trendline that has capped recovery attempts over the past week.
Technical Levels to Watch
- Immediate Support: $0.0025
- Critical Support: $0.0022
- Breakout Resistance: $0.0052 – $0.0055
- Upside Targets: $0.0072 – $0.0090
- Breakdown Target: Below $0.0015
A breakout above $0.0031–$0.0032 would flip the short-term structure bullish, potentially triggering a sharp rally toward $0.0035–$0.0037, especially if volume and whale accumulation align. On the downside, losing $0.0025, followed by $0.0022, increases the risk of a deeper slide.
24-Hour PUMP Outlook:
Base case: $0.0031 – $0.0040 range
Upside: $0.0052 – $0.0055
Downside: $0.0020
Conclusion: A Range-Bound Setup With Clear Breakout Triggers
Both MYX and PUMP prices sit at decisive technical levels. MYX leans neutral-to-cautious, needing a high-volume breakout above $4 to regain momentum. Pump.fun, meanwhile, shows a more explosive setup—with a clean break above $0.003 potentially unleashing a rapid upside extension. Over the next 24 hours, price action in both tokens will likely depend on volume spikes, whale activity, and broader market sentiment.
FAQs
MYX is reacting to broader market volatility while testing key support around $2.20–$2.40, making volume and breakout strength crucial in the short term.
MYX is neutral with fragile momentum. A breakout above $3.5 may turn the trend bullish, while losing $2.25 could signal deeper downside pressure.
PUMP is volatile and at a technical crossroads. A decisive breakout above $0.0052 could signal a rally, but failure to hold $0.0025 support risks a deeper drop. Watch for volume confirmation before any move.
You May Also Like

Negros Occidental radio veteran ‘Aksyon Fred’ Salanga dies at 77

No Brand, no more by end of June this year

