

Bitcoin Price Prediction As Santiment Says 400K BTC Has Left Exchanges In The Past Year
The Bitcoin price edged down over 1% in the past 24 hours to trade at $90,421 as of 2:42 a.m. EST on trading volume that rose 10% to $45.1 billion.
This decrease in the BTC price comes as data from Santiment shows that over 403,000 Bitcoins have moved off exchanges since Dec. 7, 2024, which is roughly 2% of the crypto’s total supply. Santiment said that this is a positive sign for the market.
The move represents a fundamental shift from short-term trading to long-term holding. When BTC is on an exchange, it is often considered for sale. Therefore, its removal suggests that investors are opting for self-custody.
While a large portion of the Bitcoin on exchanges is heading back to hodler wallets, the crypto king has recently logged one of its weakest November performances since 2018, according to Presto Research.
BTC posted monthly declines of roughly 20-25%. So far, Bitcoin’s price has tried to recover above the $90,000 zone but has been rejected just around the $94,000 level. Can the price still soar?
Bitcoin Price Trades Above Key Support Levels, Poised For A Rally
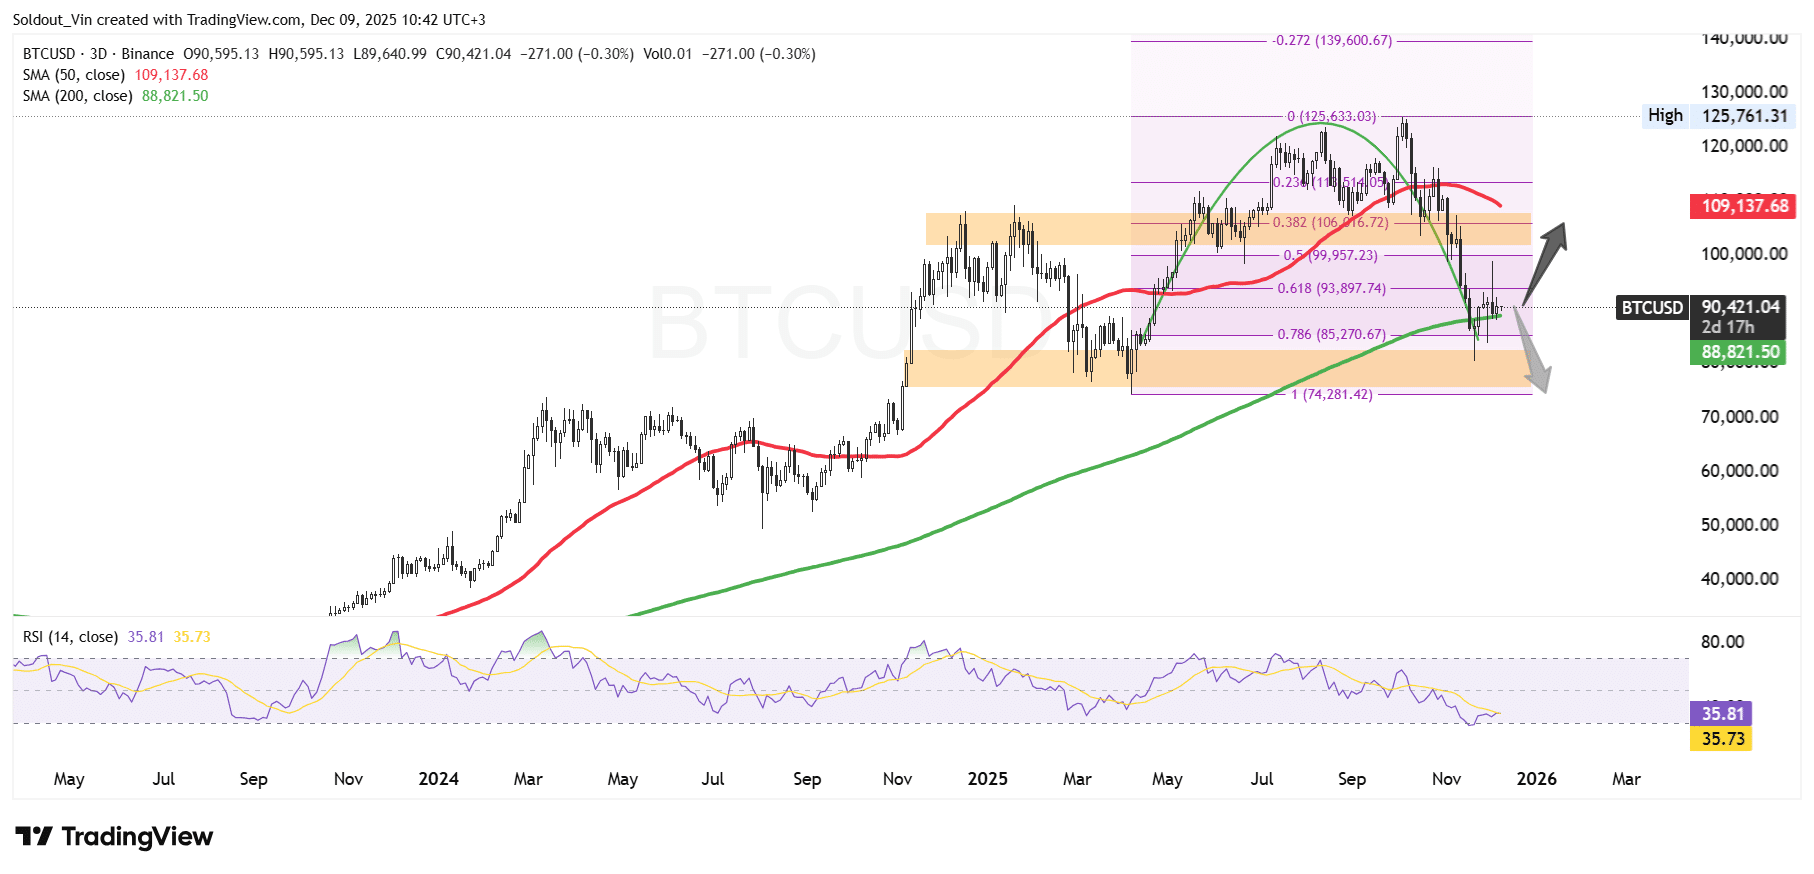
The BTC price surged in 2025, reaching an all-time high of around $125,761 in October, according to the Binance BTC/USD chart.
However, sellers began booking profits after the significant move, leading the Bitcoin price to form a bearish rounded top pattern. This led to BTC’s price breaching key support levels on the Fibonacci Retracement chart.
So far, the price of Bitcoin trades well above the 0.786 Fib level at $85,270 but below the 0.618 Fib level at $93,897, as bulls set the price up for a recovery.
BTC is still trading above the 200 Simple Moving Average (SMA) on the 3-day chart, suggesting bulls could regain complete control of the asset. However, the 50 SMA serves as the next potential long-term resistance zone around $109,137.
Meanwhile, the Relative Strength Index (RSI) appears to be recovering from the 30-oversold region to its current level of 35, suggesting buyers may be regaining control.
 BTC/USD Chart Analysis Source: TradingView
BTC Price Prediction
According to the BTC/USD chart analysis on the 3-day timeframe, BTC is sitting just above the 200 SMA ($88,821), which is acting as immediate support.
If buyers defend that level, a rebound toward the 0.618 Fibonacci zone near $94,000–$100,000 is possible, with a stronger bullish extension targeting the 50 SMA around $109,000.
A decisive breakout above that region could reopen the path toward the previous high near $125,000.
However, if the Bitcoin price falls below the 200 SMA and fails to reclaim the 0.786 Fib level ($85,200), downside pressure may intensify. In that scenario, the price could revisit the lower Fibonacci boundary near $74,000, where a larger demand zone sits.
According to Ali Martinez, an analyst on X, BTC may be forming a bearish flag, placing the possibility of the crypto’s price falling to the $70,000 support zone.
Overall, the next major move depends on whether the price of BTC can hold above the 200 SMA on the 3-day chart and regain momentum toward the mid-Fibonacci cluster.
Related News:


You May Also Like

BTC Price Shaky Near $67K While Oil Surges on Middle East Tensions: What's Next? (April 2 Update)

The changing face of elder care in Malaysia — Sayed Mohammad Reza Yamani Sayed Umar

GOP lawmakers want nothing to do with Trump's ballroom chaos: report


