

Bitcoin price shooting star on the yearly chart signals a bearish shift

The Bitcoin price has closed its yearly candle with a shooting-star-like pattern, raising concerns that selling pressure near highs could signal a broader bearish shift ahead.
- Yearly shooting star suggests selling pressure near all-time highs.
- Bitcoin is consolidating within a tightening triangle structure.
- Breakout direction and volume will confirm the next major move.
Bitcoin’s (BTC) latest yearly close has drawn attention after printing a candle that closely resembles a bearish shooting star. This candlestick formation typically appears near market tops and reflects a failed attempt by buyers to sustain higher prices.
In Bitcoin’s case, price wicked aggressively into all-time-high territory before closing significantly lower, signaling that sellers were active and dominant near the highs.
While a single yearly candle does not confirm a full trend reversal, its placement at the top of a multi-year advance makes it a meaningful signal that warrants closer examination.
Bitcoin price key technical points
- Yearly shooting star indicates seller dominance near all-time highs
- Lower time frames show compression within a triangle structure
- Point of Control acts as the key pivot for directional continuation
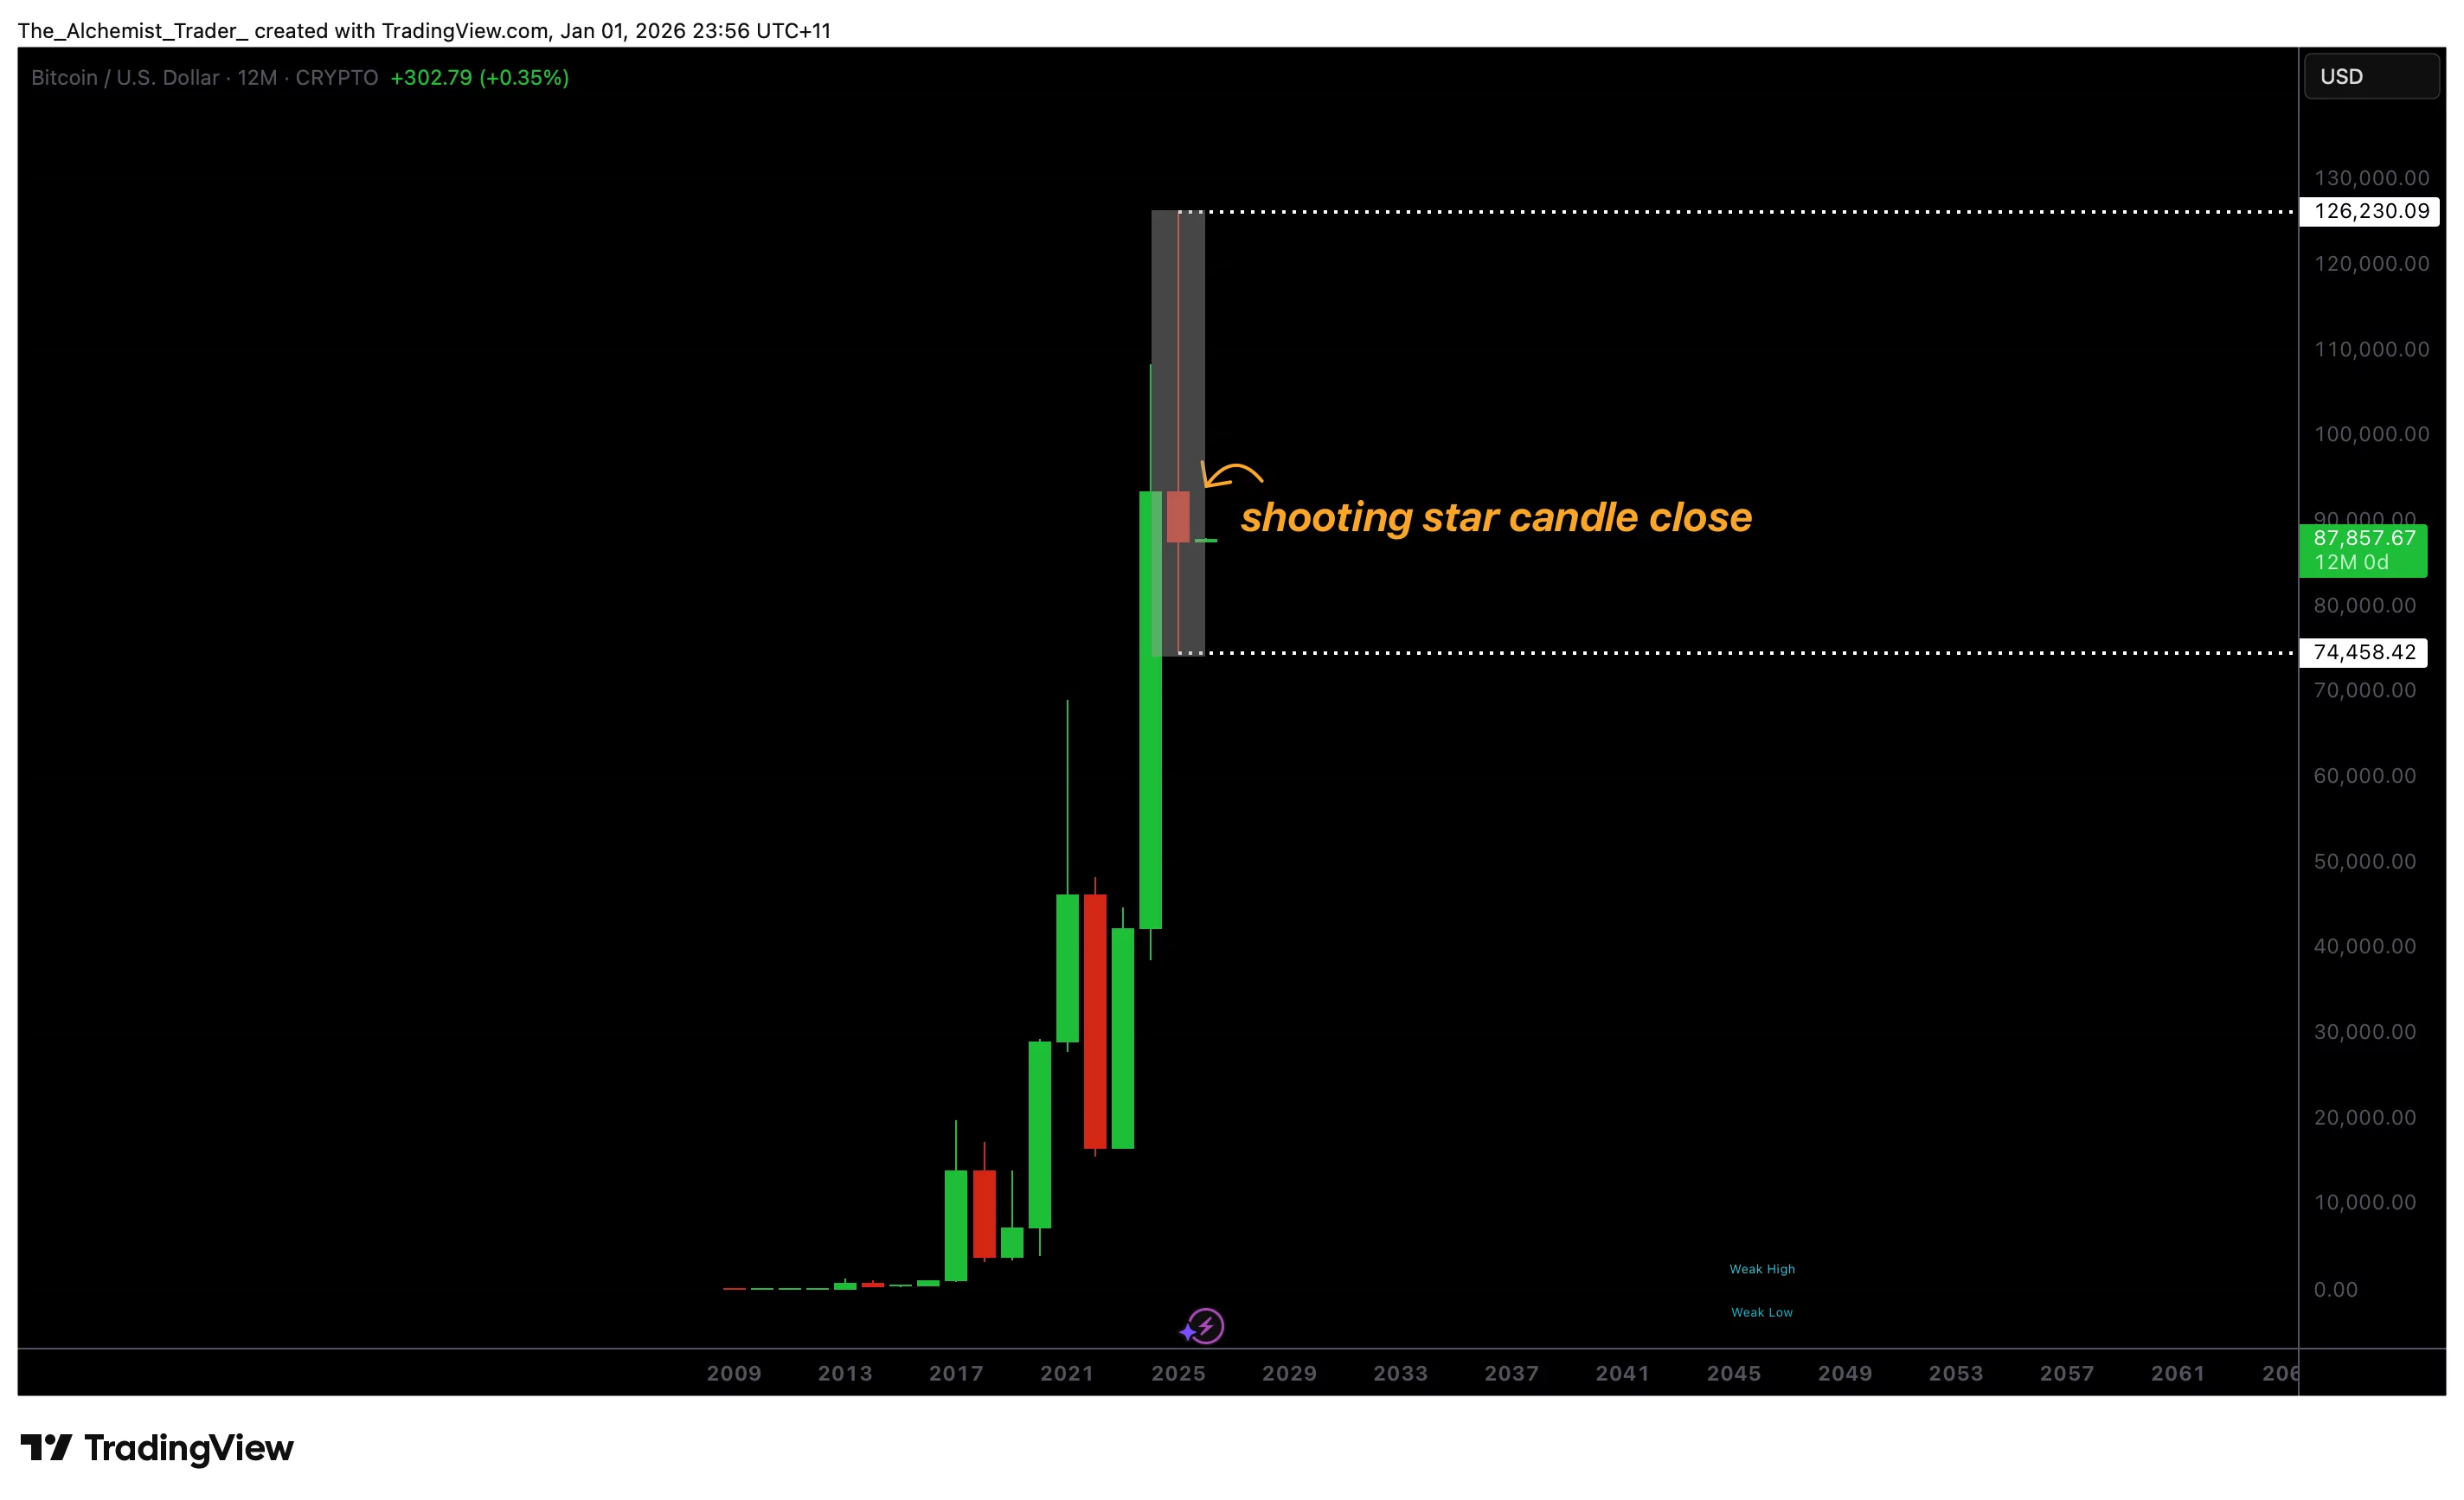
From a higher-time-frame perspective, the shooting star reflects rejection at premium prices. The long upper wick suggests strong upside attempts were met with equally strong supply, preventing Bitcoin from holding higher valuations into the yearly close. Historically, such candles often mark transition phases where markets move from expansion into consolidation or corrective behavior as supply and demand rebalance.
However, confirmation is critical. On higher time frames, such as the yearly chart, bearish implications gain validity only if followed by acceptance below key structural levels in subsequent price action. Without follow-through, shooting stars can simply represent exhaustion within an ongoing range rather than the beginning of a sustained downtrend.
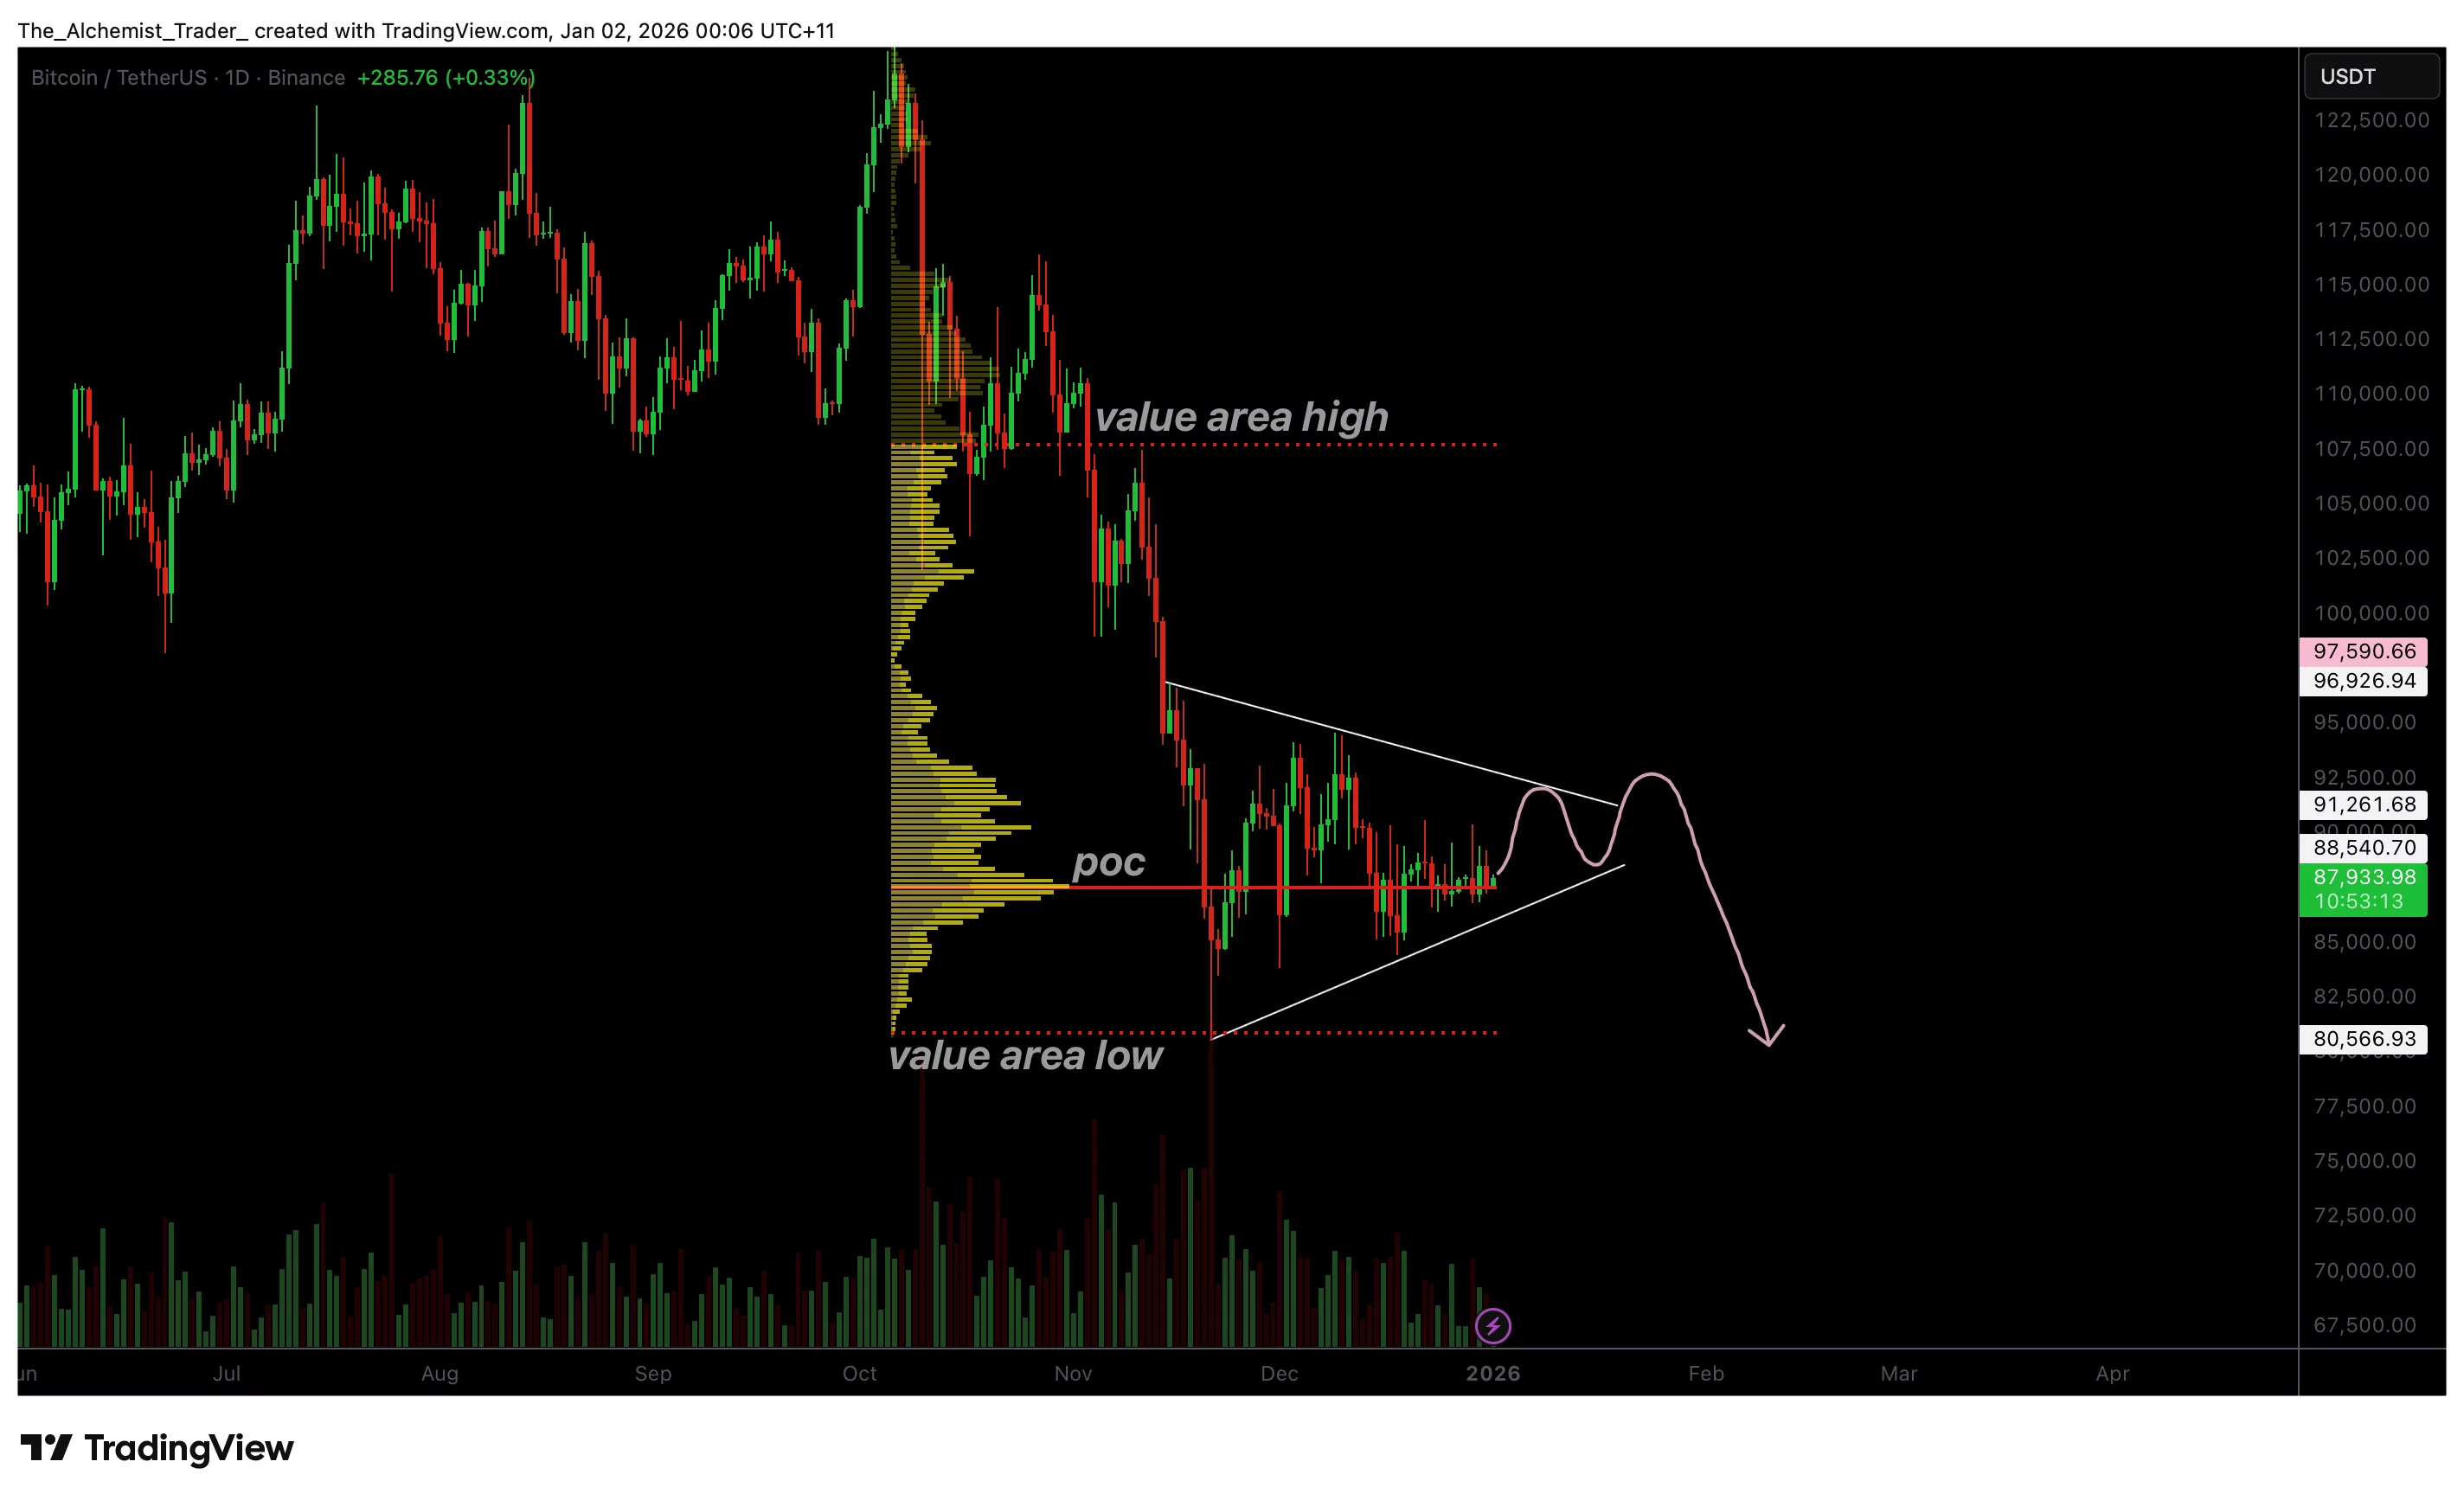
Zooming in on shorter time frames, Bitcoin is currently trading within a tight triangular equilibrium. Price is compressing between lower highs and higher lows, reflecting indecision following the rejection from highs. This consolidation phase suggests that the market is absorbing the prior move while participants wait for new information or liquidity to drive direction.
The midpoint of this triangle aligns closely with the Point of Control (POC) of the recent downtrend, the price level with the highest traded volume. This makes the POC a critical inflection zone. Holding above it implies balance and stability, while acceptance below it would likely trigger a rotation toward the Value Area Low, reinforcing the bearish implications of the yearly candle.
Volume behavior remains muted during this compression, which is typical as volatility contracts. Historically, such conditions precede sharp expansions once price exits the structure. The direction of that expansion will largely determine whether the shooting star evolves into a meaningful bearish signal or fades into consolidation noise.
What to expect in the coming price action
As Bitcoin trades deeper into the triangle apex, a volatility expansion is increasingly likely. A downside break below the Point of Control, mainly if supported by rising sell volume, would strengthen the bearish interpretation of the yearly shooting star and open the door for a move toward lower value areas.
Conversely, a high-volume breakout above triangle resistance would invalidate the bearish setup and suggest that the yearly candle reflects temporary exhaustion rather than a structural shift. Until a decisive breakout occurs, Bitcoin is likely to remain range-bound.


You May Also Like

NZD/USD holds losses near 0.5850 on mixed Chinese data, US CPI looms

Bank of Canada cuts rate to 2.5% as tariffs and weak hiring hit economy


