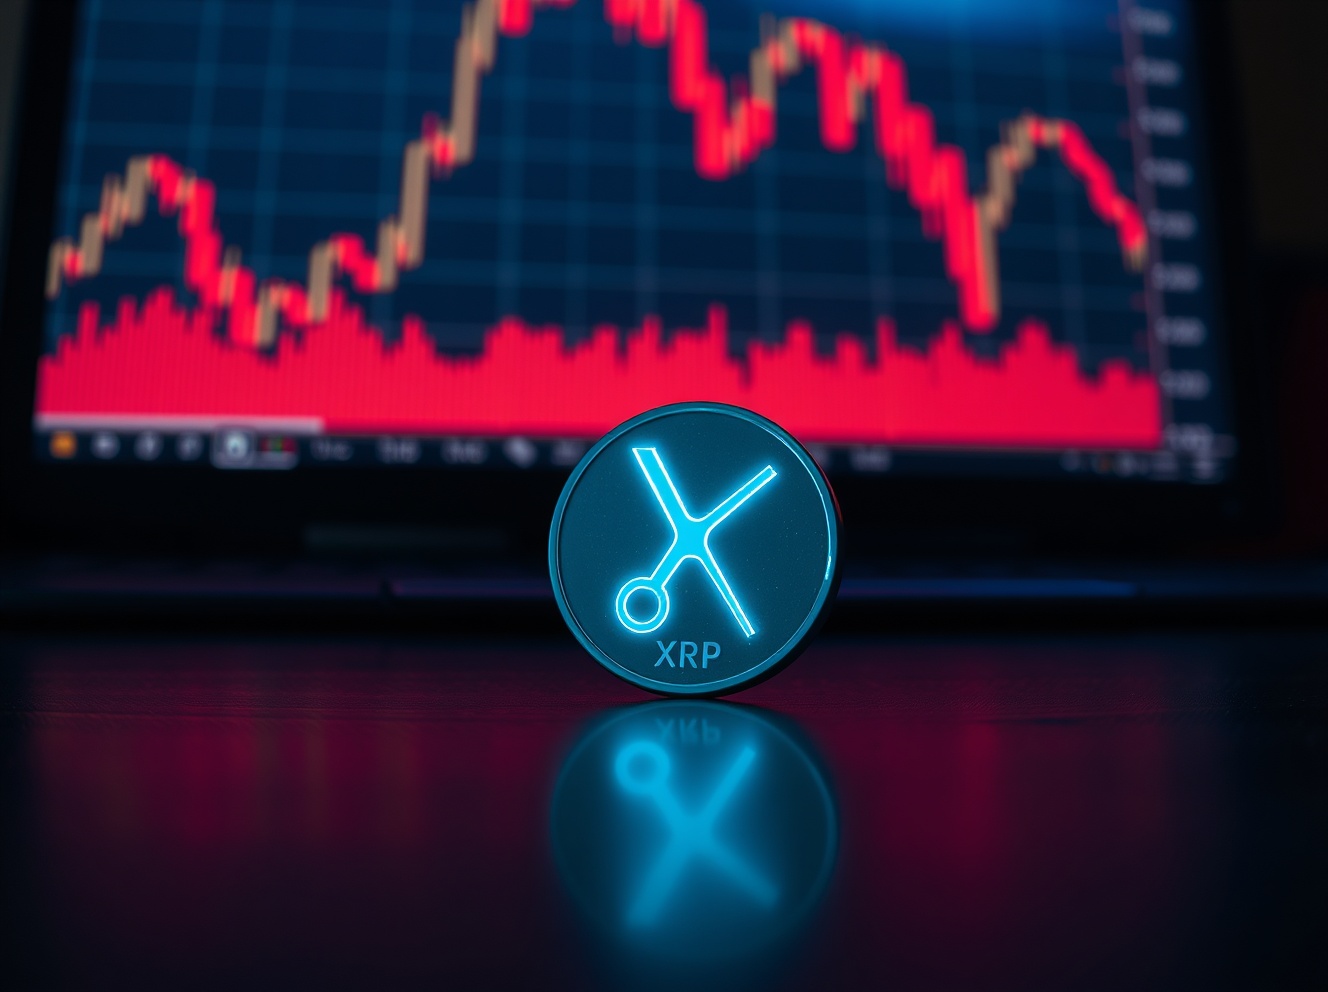
ARB Price Prediction: Arbitrum Eyes $0.14 Recovery Amid Oversold Conditions
Ted Hisokawa Feb 15, 2026 08:58
Arbitrum (ARB) trades at $0.12 with RSI at 34.38 suggesting oversold conditions. Technical analysis points to $0.14 near-term target with potential bounce from current support levels.

ARB Price Prediction Summary
• Short-term target (1 week): $0.14 • Medium-term forecast (1 month): $0.11-$0.17 range
• Bullish breakout level: $0.17 • Critical support: $0.11
What Crypto Analysts Are Saying About Arbitrum
While specific analyst predictions from the past 24 hours are limited, recent forecasts from late January provide context for the current ARB price prediction. James Ding noted on January 26, 2026, that "Arbitrum (ARB) analysts forecast 47-65% gains to $0.25-$0.28 range despite current bearish momentum at $0.17, with RSI oversold conditions presenting potential buying opportunity."
Similarly, Alvin Lang highlighted that despite bearish momentum, analyst predictions suggest "$0.25-$0.28 recovery potential by February 2026," though these targets now appear optimistic given ARB's current price action at $0.12.
According to on-chain data, Arbitrum's fundamentals remain solid despite the price decline, with Layer 2 adoption metrics continuing to show network growth. The disconnect between technical oversold conditions and analyst targets suggests a potential opportunity for patient investors.
ARB Technical Analysis Breakdown
The current technical picture for Arbitrum presents a mixed but cautiously optimistic outlook for this ARB price prediction. Trading at $0.12, ARB sits well below most moving averages, indicating sustained bearish pressure. The RSI at 34.38 places ARB in neutral territory, though approaching oversold conditions that historically precede bounce attempts.
The MACD histogram at 0.0000 shows bearish momentum is stalling, potentially signaling an inflection point. ARB's position within the Bollinger Bands at 0.36 suggests the token is trading in the lower portion of its recent range, with the lower band at $0.09 providing significant downside buffer.
Most concerning is ARB's position relative to longer-term moving averages, with the SMA 200 at $0.31 highlighting the magnitude of the decline from previous highs. However, the proximity to the SMA 7 at $0.11 suggests short-term support may be building.
Arbitrum Price Targets: Bull vs Bear Case
Bullish Scenario
The bullish case for this Arbitrum forecast centers on a recovery toward the SMA 20 at $0.13, with initial resistance at $0.12. A confirmed break above current levels could target the EMA 26 at $0.14, representing a 17% upside from current prices.
Key technical confirmation would require RSI breaking above 40 and MACD histogram turning positive. Volume expansion above the current 24-hour average of $5.6 million would validate any upward move. The ultimate bullish target remains the SMA 50 at $0.17, aligning with the Bollinger Band upper band.
Bearish Scenario
The bearish scenario for ARB involves a breakdown below the SMA 7 support at $0.11. This could trigger selling toward the psychological $0.10 level, with the Bollinger Band lower band at $0.09 representing the next major support zone.
Risk factors include continued selling pressure from long-term holders, broader crypto market weakness, and potential concerns about Layer 2 competition. A break below $0.09 would invalidate near-term recovery prospects and could lead to a test of yearly lows.
Should You Buy ARB? Entry Strategy
For this ARB price prediction strategy, consider dollar-cost averaging between $0.11-$0.12 levels. The current price near $0.12 offers reasonable risk-reward, especially if RSI continues declining toward oversold territory below 30.
Conservative entry points should focus on confirmed support at $0.11, with aggressive traders potentially entering on any RSI divergence above 30. Stop-loss placement below $0.09 provides approximately 25% downside protection while allowing room for normal volatility.
Position sizing should remain modest given the uncertain macro environment and ARB's position below major moving averages. Consider scaling out near $0.14 resistance and $0.17 for longer-term holdings.
Conclusion
This ARB price prediction suggests cautious optimism for Arbitrum's near-term prospects. While the token faces significant technical headwinds trading below most moving averages, oversold conditions and stalling bearish momentum create potential for a relief rally toward $0.14.
The Arbitrum forecast remains challenging in the medium term, with recovery dependent on broader market sentiment and Layer 2 adoption trends. Investors should maintain realistic expectations and proper risk management, as cryptocurrency price predictions carry inherent uncertainty and markets can remain irrational longer than expected.
Disclaimer: This analysis is for educational purposes only and should not be considered financial advice. Cryptocurrency investments carry significant risk, and past performance does not guarantee future results.
Image source: Shutterstock- arb price analysis
- arb price prediction