Kripto al
Bazarlar
Spot
FuturesBTC
Earn
Tədbir mərkəzi
Mükafat mərkəzi
Daha çox
100%+ Ehtiyatların sübutu
How to Use the Volume Oscillator (VOSC) in Stock Trading: A Complete Beginner's GuideHow to Use the Volume Oscillator (VOSC) in Stock Trading: A Complete Beginner's Guide
Kateqoriya siyahısı
Ləğv edin

How to Use the Volume Oscillator (VOSC) in Stock Trading: A Complete Beginner's Guide

Key Takeaways:

  • The Volume Oscillator (VOSC) compares short-term and long-term moving averages of trading volume to assess changes in volume trends.
  • Readings above zero indicate stronger volume and more active trading, while readings below zero indicate weaker volume and quieter trading.
  • VOSC can help confirm breakouts above resistance or breakdowns below support. Breakouts accompanied by higher volume are generally more reliable.
  • Divergence between price and volume can provide an early warning of a potential trend reversal, and VOSC can help traders identify it.
  • MEXC Stocks supports VOSC, allowing users to add the indicator directly to their charts and customize its parameters.

1. What Is the Volume Oscillator?


The Volume Oscillator (VOSC) is a technical analysis tool focused on trading volume. Its underlying principle is that changes in volume relative to recent levels can be more informative than the absolute volume level.

Rather than simply plotting a moving average of volume, VOSC compares short-term and long-term volume moving averages to analyze volume trends and identify potential changes in direction. Changes in volume can precede changes in price, which is why VOSC may provide an early indication of a developing move.

2. How to Interpret Volume Oscillator Signals


2.1 Above zero: Increasing volume


When VOSC is above zero, the short-term volume moving average is above the long-term average. This indicates stronger recent volume and more active trading. If the price is already trending upward or downward, this volume activity can lend support to the existing trend and increase confidence in its continuation.

2.2 Below zero: Decreasing volume


When VOSC is below zero, volume is contracting and trading activity is weakening. This may warn that the current price direction lacks volume support. The price may move into sideways consolidation or potentially reverse.

2.3 Short-term opportunities at extreme levels


When VOSC rises sharply from a negative reading and crosses above zero, it indicates a sharp recovery in trading activity after a period of very low volume. This may accompany the start of a new price move and help traders assess potential short-term buying opportunities in the context of the price trend.

3. Practical Uses of the Volume Oscillator in Stocks Trading


3.1 Confirming trend strength


Reading price and volume together is a basic way to assess the strength of a trend. A rising or falling price accompanied by expanding volume can indicate a strong trend. When a stock continues to form higher highs and higher lows while VOSC also rises, the volume pattern lends further support to the uptrend.

3.2 Confirming support and resistance breaks


VOSC can help assess whether a break of a key price level is supported by volume. A break below support on expanding volume generally suggests stronger selling pressure than a break on declining volume. Similarly, a break above resistance on expanding volume suggests stronger buying activity and may be more likely to hold. When the price crosses a key level, traders can check whether VOSC is above zero to help filter out market noise.

3.3 Identifying price-volume divergence


When the price rises but VOSC continues to decline and forms lower highs, the advance may be losing volume support. This bearish divergence may warn of a potential reversal. By contrast, when the price falls while VOSC rises, expanding volume may support a continuation of the downtrend.

It is important to distinguish these situations: Rising prices accompanied by declining volume may be bearish, while falling prices accompanied by expanding volume may also be bearish.

4. How to Use the Volume Oscillator on MEXC


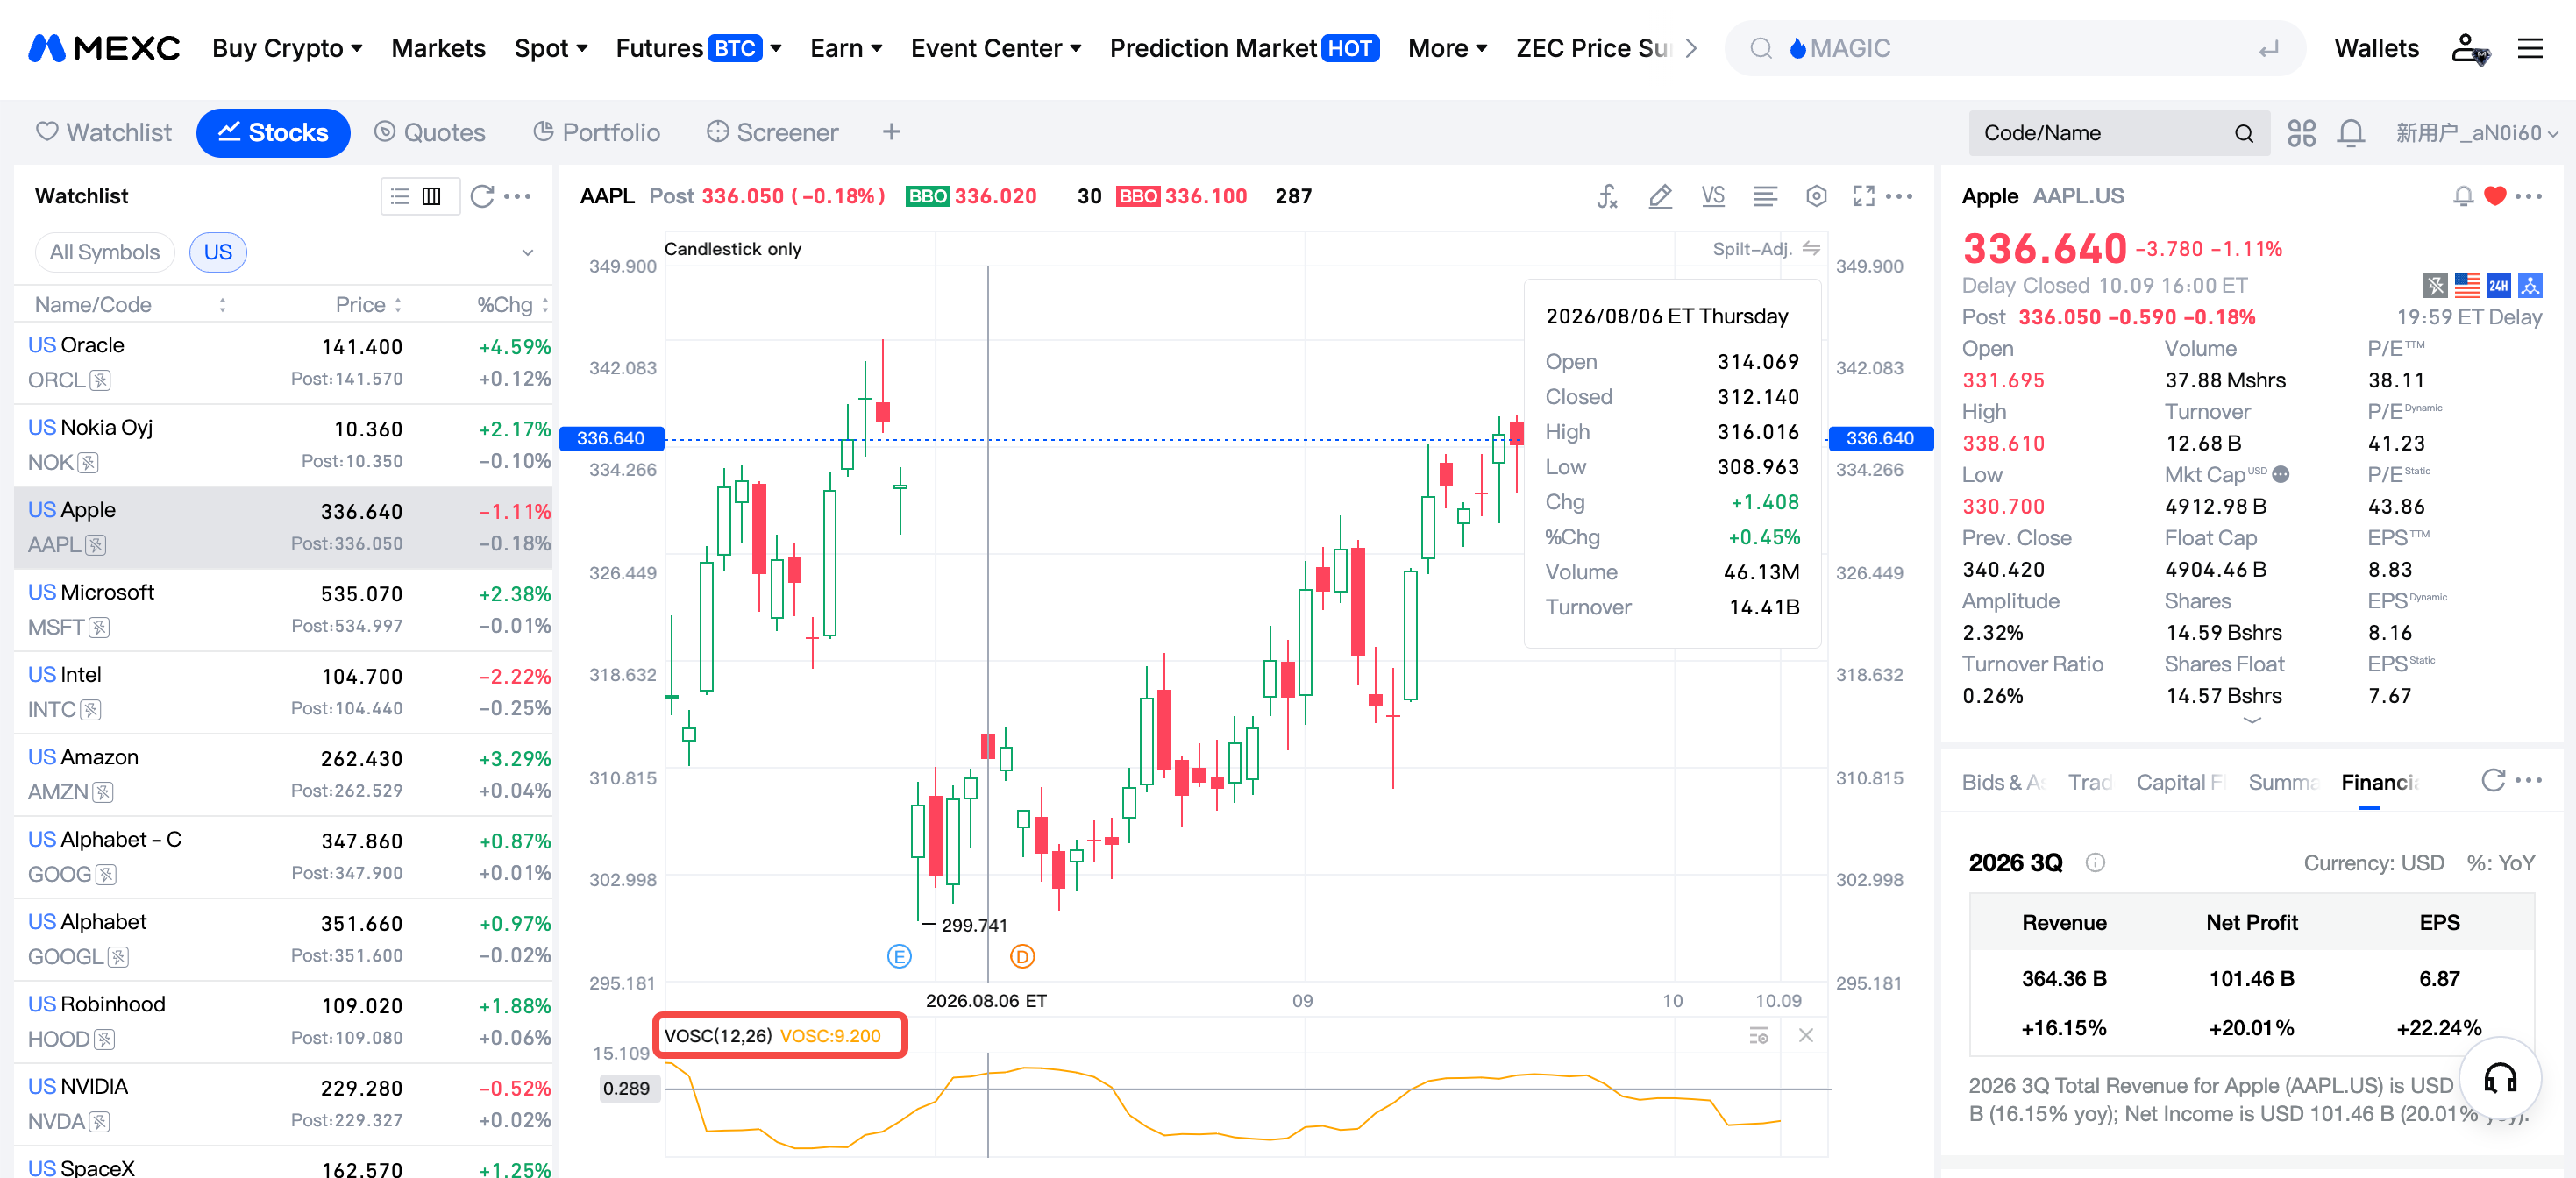
MEXC Stocks supports the Volume Oscillator. Open the relevant stock chart on MEXC, add VOSC from the indicator list, and customize the short-term and long-term moving average parameters to suit your trading timeframe.

Beginners can start with the default parameters to observe how the indicator interacts with price, then use trendlines and support and resistance levels for a more complete assessment. MEXC's chart tools support multiple timeframes, allowing you to assess the broader trend on the daily chart and look for potential entries on shorter timeframes.


5. Important Considerations When Using the Volume Oscillator


1) VOSC is a confirmation tool, not a standalone buy or sell signal system. Using it alone can lead to misinterpretation, so combine it with price patterns, trend analysis, and other analytical methods.

2) During short-term fluctuations, VOSC peaks and troughs may occur alongside short-term price highs and lows. Over longer-term trends, major VOSC peaks or troughs may appear before the corresponding price turning points. Traders should distinguish between these contexts.

3) No technical indicator is 100% accurate, and past performance does not guarantee future results. Appropriate position sizing and risk management remain essential.

6. Volume Oscillator FAQ


6.1 What is the Volume Oscillator in trading?


The Volume Oscillator is a technical tool that measures the difference between short-term and long-term moving averages of trading volume. Expressed as a percentage, it fluctuates around zero and helps identify whether volume is strengthening or weakening, providing additional context for assessing price trends.

6.2 How do you use the Volume Oscillator in trading?


There are three main uses: Assessing trend strength when the indicator is above zero, checking volume confirmation when the price breaks key support or resistance, and identifying price-volume divergence that may warn of a potential reversal. It is best used alongside other analytical tools.

6.3 Which oscillator is best for trading?


No single indicator is best for every trader. The choice depends on your trading style. VOSC focuses on volume analysis, while other oscillators focus on price momentum. Experienced traders often combine volume-based and price-based indicators to make more informed assessments.

6.4 Is On-Balance Volume a useful indicator?


On-Balance Volume (OBV) is a classic cumulative volume indicator that adds or subtracts volume to assess buying and selling pressure. It is useful for observing medium- to long-term volume accumulation. OBV and VOSC complement each other: OBV tracks the cumulative direction of volume, while VOSC highlights changes in volume relative to its moving averages.

6.5 Can the Volume Oscillator be used for cryptocurrency trading?


Yes. The indicator can be applied to any market with trading volume data, including stocks, futures, and cryptocurrencies. On MEXC, users can apply it to Stocks charts as well as chart analysis for other trading instruments.


How to Use the Volume Oscillator (VOSC) in Stock Trading: A Complete Beginner's Guide

Key Takeaways:

  • The Volume Oscillator (VOSC) compares short-term and long-term moving averages of trading volume to assess changes in volume trends.
  • Readings above zero indicate stronger volume and more active trading, while readings below zero indicate weaker volume and quieter trading.
  • VOSC can help confirm breakouts above resistance or breakdowns below support. Breakouts accompanied by higher volume are generally more reliable.
  • Divergence between price and volume can provide an early warning of a potential trend reversal, and VOSC can help traders identify it.
  • MEXC Stocks supports VOSC, allowing users to add the indicator directly to their charts and customize its parameters.

1. What Is the Volume Oscillator?


The Volume Oscillator (VOSC) is a technical analysis tool focused on trading volume. Its underlying principle is that changes in volume relative to recent levels can be more informative than the absolute volume level.

Rather than simply plotting a moving average of volume, VOSC compares short-term and long-term volume moving averages to analyze volume trends and identify potential changes in direction. Changes in volume can precede changes in price, which is why VOSC may provide an early indication of a developing move.

2. How to Interpret Volume Oscillator Signals


2.1 Above zero: Increasing volume


When VOSC is above zero, the short-term volume moving average is above the long-term average. This indicates stronger recent volume and more active trading. If the price is already trending upward or downward, this volume activity can lend support to the existing trend and increase confidence in its continuation.

2.2 Below zero: Decreasing volume


When VOSC is below zero, volume is contracting and trading activity is weakening. This may warn that the current price direction lacks volume support. The price may move into sideways consolidation or potentially reverse.

2.3 Short-term opportunities at extreme levels


When VOSC rises sharply from a negative reading and crosses above zero, it indicates a sharp recovery in trading activity after a period of very low volume. This may accompany the start of a new price move and help traders assess potential short-term buying opportunities in the context of the price trend.


3. Practical Uses of the Volume Oscillator in Stocks Trading


3.1 Confirming trend strength


Reading price and volume together is a basic way to assess the strength of a trend. A rising or falling price accompanied by expanding volume can indicate a strong trend. When a stock continues to form higher highs and higher lows while VOSC also rises, the volume pattern lends further support to the uptrend.

3.2 Confirming support and resistance breaks


VOSC can help assess whether a break of a key price level is supported by volume. A break below support on expanding volume generally suggests stronger selling pressure than a break on declining volume. Similarly, a break above resistance on expanding volume suggests stronger buying activity and may be more likely to hold. When the price crosses a key level, traders can check whether VOSC is above zero to help filter out market noise.

3.3 Identifying price-volume divergence


When the price rises but VOSC continues to decline and forms lower highs, the advance may be losing volume support. This bearish divergence may warn of a potential reversal. By contrast, when the price falls while VOSC rises, expanding volume may support a continuation of the downtrend.

It is important to distinguish these situations: Rising prices accompanied by declining volume may be bearish, while falling prices accompanied by expanding volume may also be bearish.

4. How to Use the Volume Oscillator on MEXC


MEXC Stocks supports the Volume Oscillator. Open the relevant stock chart on MEXC, add VOSC from the indicator list, and customize the short-term and long-term moving average parameters to suit your trading timeframe.

Beginners can start with the default parameters to observe how the indicator interacts with price, then use trendlines and support and resistance levels for a more complete assessment. MEXC's chart tools support multiple timeframes, allowing you to assess the broader trend on the daily chart and look for potential entries on shorter timeframes.


5. Important Considerations When Using the Volume Oscillator


1) VOSC is a confirmation tool, not a standalone buy or sell signal system. Using it alone can lead to misinterpretation, so combine it with price patterns, trend analysis, and other analytical methods.

2) During short-term fluctuations, VOSC peaks and troughs may occur alongside short-term price highs and lows. Over longer-term trends, major VOSC peaks or troughs may appear before the corresponding price turning points. Traders should distinguish between these contexts.

3) No technical indicator is 100% accurate, and past performance does not guarantee future results. Appropriate position sizing and risk management remain essential.

6. Volume Oscillator FAQ


6.1 What is the Volume Oscillator in trading?


The Volume Oscillator is a technical tool that measures the difference between short-term and long-term moving averages of trading volume. Expressed as a percentage, it fluctuates around zero and helps identify whether volume is strengthening or weakening, providing additional context for assessing price trends.

6.2 How do you use the Volume Oscillator in trading?


There are three main uses: Assessing trend strength when the indicator is above zero, checking volume confirmation when the price breaks key support or resistance, and identifying price-volume divergence that may warn of a potential reversal. It is best used alongside other analytical tools.

6.3 Which oscillator is best for trading?


No single indicator is best for every trader. The choice depends on your trading style. VOSC focuses on volume analysis, while other oscillators focus on price momentum. Experienced traders often combine volume-based and price-based indicators to make more informed assessments.

6.4 Is On-Balance Volume a useful indicator?


On-Balance Volume (OBV) is a classic cumulative volume indicator that adds or subtracts volume to assess buying and selling pressure. It is useful for observing medium- to long-term volume accumulation. OBV and VOSC complement each other: OBV tracks the cumulative direction of volume, while VOSC highlights changes in volume relative to its moving averages.

6.5 Can the Volume Oscillator be used for cryptocurrency trading?


Yes. The indicator can be applied to any market with trading volume data, including stocks, futures, and cryptocurrencies. On MEXC, users can apply it to Stocks charts as well as chart analysis for other trading instruments.